
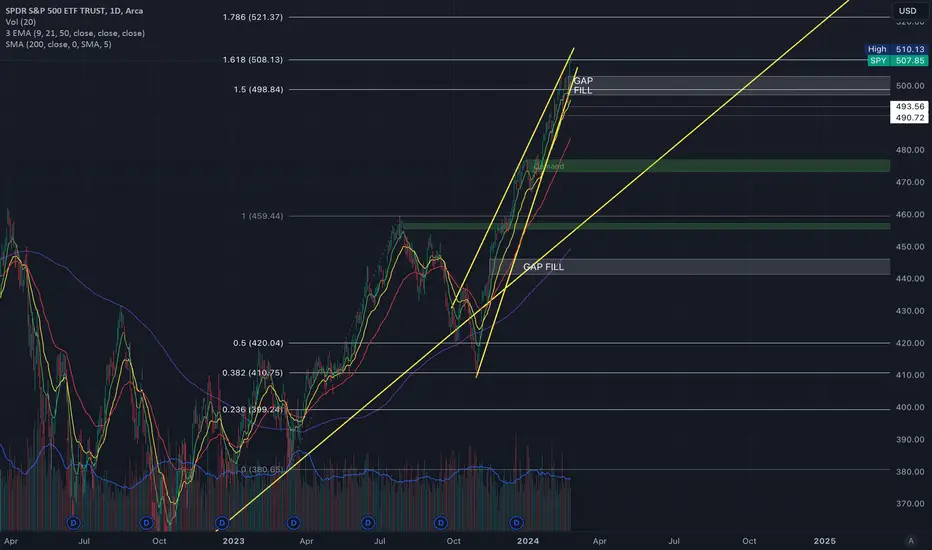
The Daily chart showed that price started below the 9EMA for this week and gapped up above the 9EMA on Thursday and closed the week well above it. Gap fill is at 497.37 and Support is at 503.50 which was a previous daily high. There is a Double Bearish Divergence on the RSI from a high of 74.77 to 72.56 and closed the week on a bearish candle that closed +0.07% with a 68.53 RSI.
Based on a Fibonacci Retracement (380.65 -> 459.44 bounced off the 0.382 Fib at 410.75) and Extension (2.0 at 538.23), if price holds 508.13 (1.618) it can run to 521.37 (1.786).
Based on a Fibonacci Retracement (380.65 -> 459.44 bounced off the 0.382 Fib at 410.75) and Extension (2.0 at 538.23), if price holds 508.13 (1.618) it can run to 521.37 (1.786).

Отказ от ответственности
Информация и публикации не предназначены для предоставления и не являются финансовыми, инвестиционными, торговыми или другими видами советов или рекомендаций, предоставленных или одобренных TradingView. Подробнее читайте в Условиях использования.
Отказ от ответственности
Информация и публикации не предназначены для предоставления и не являются финансовыми, инвестиционными, торговыми или другими видами советов или рекомендаций, предоставленных или одобренных TradingView. Подробнее читайте в Условиях использования.