
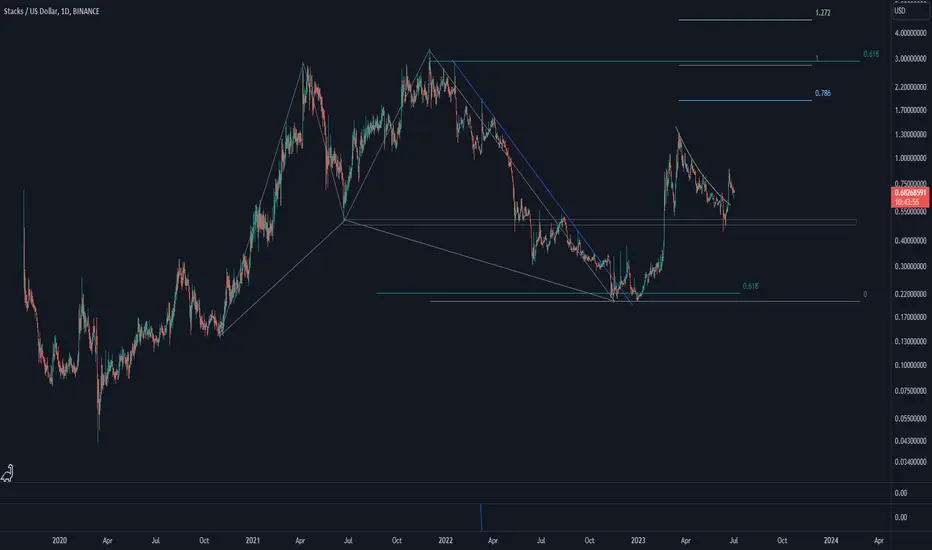
Stacks started its upward impulse wave sooner than others. Back when a harmonic pattern ended and price settled on 0.618 Fibonacci level, STX started a strong upward wave. After a 500% growth, corrective wave started. Now it seems STX posed for continuation. Let's see what happens.
Заметка
STX is breaking the second curved downtrend line. Let's see how up it can go.
Заметка
STX broke the descending triangle correction pattern is going up.
Заметка
STX broke the major downtrend line, and broke it with momentum. This behavior could be sign of powerful upward impulse wave indicating that STX could see much higher price. Let's see what happens.
Заметка
After STX broke the major downtrend line, it went up, and still going. Now, STX is approaching the intersection of the major horizontal area and the possible ascending channel's upper line. Let's see how STX reacts to these areas.
Заметка
So, STX went up very well and reached both the ascending channel's upper line and major horizontal resistance area. Unless important news about STX cause to burst through this area upward, correction is most likely to happen. Let's see what happens.
Заметка
So, correction brought STX down to the channel's middle line. Let's see if STX's correction ends here and an upward move starts or not.
Заметка
So, STX went down to the channel's lower line. Recently, STX broke the downtrend line, and it seems ready for the next upward phase. Let's see what happens.

Отказ от ответственности
Информация и публикации не предназначены для предоставления и не являются финансовыми, инвестиционными, торговыми или другими видами советов или рекомендаций, предоставленных или одобренных TradingView. Подробнее читайте в Условиях использования.
Отказ от ответственности
Информация и публикации не предназначены для предоставления и не являются финансовыми, инвестиционными, торговыми или другими видами советов или рекомендаций, предоставленных или одобренных TradingView. Подробнее читайте в Условиях использования.