
### Swiggy Ltd. (4H) – Elliott Wave Analysis
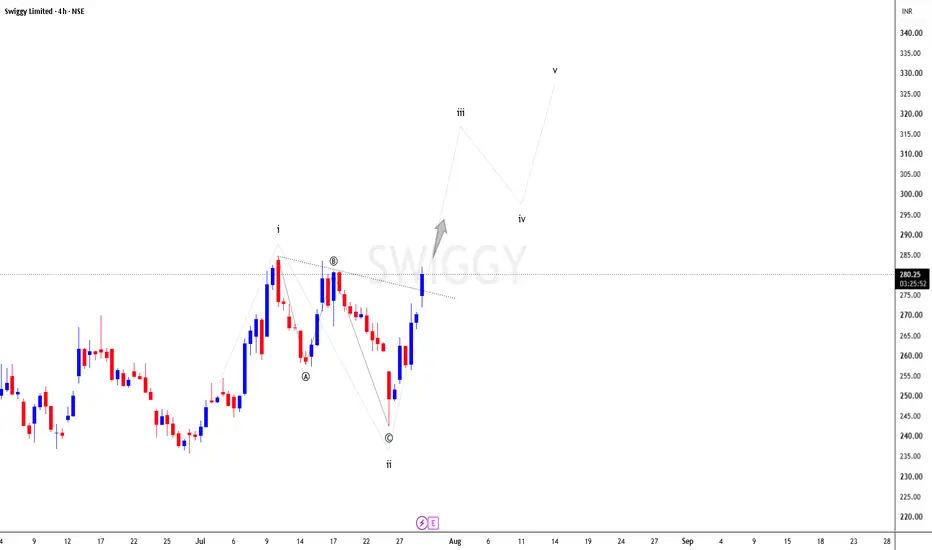
This chart shows a **4-hour (4H) Elliott Wave analysis** of **Swiggy Ltd.** and suggests that the stock may have completed an **A-B-C corrective pattern** and is beginning a new **five-wave bullish impulse**.
### Chart Description
* **A-B-C Correction Completed**
* **Wave A:** Initial decline from the previous high.
* **Wave B:** Temporary recovery (pullback).
* **Wave C:** Final decline, completing the correction.
* After **Wave C**, the stock has shown a **strong bullish reversal**, indicating that buyers are gaining control.
* The price is now attempting to **break above the descending trendline** (dotted line).
* A successful breakout could confirm the beginning of a new uptrend.
* The gray arrow on the chart represents the expected bullish move after the breakout.
### Elliott Wave Projection
The projected bullish structure consists of five waves:
* **Wave i:** The first upward move after the correction.
* **Wave ii:** A shallow pullback that should not fall below the start of Wave i.
* **Wave iii:** The strongest and longest wave, typically driven by high buying momentum.
* **Wave iv:** A healthy correction after Wave iii, usually without overlapping Wave i.
* **Wave v:** The final rally before another larger correction or a new A-B-C pattern begins.
### Current Market View
* The current price is around **$280** (chart value ₹280.10).
* The stock is trading near a **major descending resistance trendline**.
* If a **4-hour candle closes above this trendline with strong volume**, it could confirm the start of **Wave iii**, which is usually the most powerful bullish wave.
* If the breakout fails, the stock may experience a short-term pullback before attempting another rally.
### Potential Price Targets (Projection Only)
* **Wave iii:** Around **₹315–₹318**
* **Wave iv:** Around **₹295–₹300**
* **Wave v:** Around **₹328–₹332**
### Conclusion
The chart presents a **bullish Elliott Wave scenario**, where Swiggy appears to have completed its corrective phase and is preparing for a new impulsive uptrend. However, this projection becomes more reliable only after a confirmed breakout above the descending trendline with strong buying volume.
This chart shows a **4-hour (4H) Elliott Wave analysis** of **Swiggy Ltd.** and suggests that the stock may have completed an **A-B-C corrective pattern** and is beginning a new **five-wave bullish impulse**.
### Chart Description
* **A-B-C Correction Completed**
* **Wave A:** Initial decline from the previous high.
* **Wave B:** Temporary recovery (pullback).
* **Wave C:** Final decline, completing the correction.
* After **Wave C**, the stock has shown a **strong bullish reversal**, indicating that buyers are gaining control.
* The price is now attempting to **break above the descending trendline** (dotted line).
* A successful breakout could confirm the beginning of a new uptrend.
* The gray arrow on the chart represents the expected bullish move after the breakout.
### Elliott Wave Projection
The projected bullish structure consists of five waves:
* **Wave i:** The first upward move after the correction.
* **Wave ii:** A shallow pullback that should not fall below the start of Wave i.
* **Wave iii:** The strongest and longest wave, typically driven by high buying momentum.
* **Wave iv:** A healthy correction after Wave iii, usually without overlapping Wave i.
* **Wave v:** The final rally before another larger correction or a new A-B-C pattern begins.
### Current Market View
* The current price is around **$280** (chart value ₹280.10).
* The stock is trading near a **major descending resistance trendline**.
* If a **4-hour candle closes above this trendline with strong volume**, it could confirm the start of **Wave iii**, which is usually the most powerful bullish wave.
* If the breakout fails, the stock may experience a short-term pullback before attempting another rally.
### Potential Price Targets (Projection Only)
* **Wave iii:** Around **₹315–₹318**
* **Wave iv:** Around **₹295–₹300**
* **Wave v:** Around **₹328–₹332**
### Conclusion
The chart presents a **bullish Elliott Wave scenario**, where Swiggy appears to have completed its corrective phase and is preparing for a new impulsive uptrend. However, this projection becomes more reliable only after a confirmed breakout above the descending trendline with strong buying volume.

Отказ от ответственности
Информация и публикации не предназначены для предоставления и не являются финансовыми, инвестиционными, торговыми или другими видами советов или рекомендаций, предоставленных или одобренных TradingView. Подробнее читайте в Условиях использования.
Отказ от ответственности
Информация и публикации не предназначены для предоставления и не являются финансовыми, инвестиционными, торговыми или другими видами советов или рекомендаций, предоставленных или одобренных TradingView. Подробнее читайте в Условиях использования.