
TALBROAUTO : Weekly Breakout Consolidation Cleared with Momentum
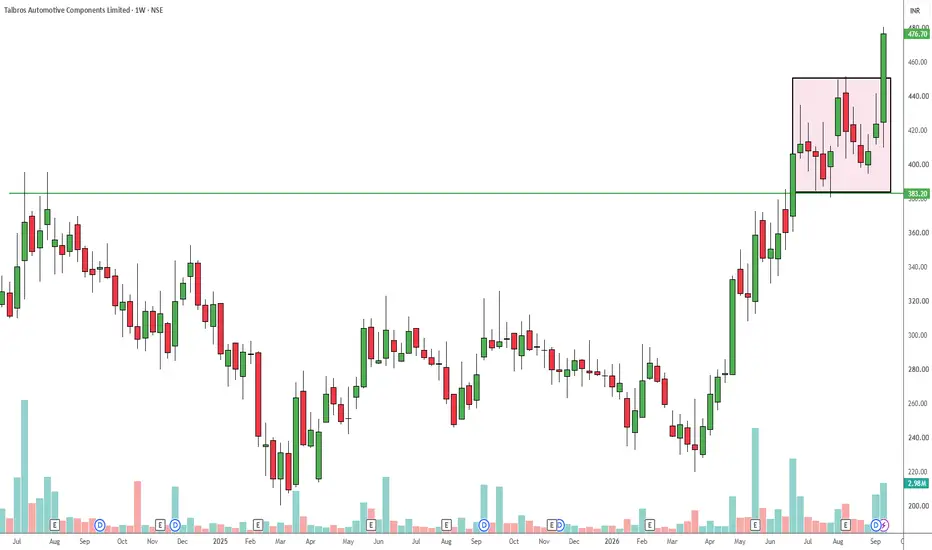
The weekly chart for Talbros Automotive Components Limited presents a compelling continuation setup following a period of healthy accumulation.
Previously, the price successfully cleared a major historical resistance line distinctly marked at 383.20. After this initial breakout, the stock spent several weeks consolidating within a defined rectangular zone (highlighted by the pink box) between the 383.20 support floor and a resistance ceiling near 450.
The most recent weekly candle has registered a powerful breakout above this consolidation box, closing near the absolute high of the week at 476.70, which represents a 12.50% gain.
This structural shift, combined with the rising volume bars visible at the bottom of the chart during the breakout, signals that buyers have regained full control to initiate the next leg of the primary uptrend.
Entry Point: The current market price around 476.70 offers a primary entry, with a secondary accumulation zone on any minor retest of the upper boundary of the pink box near 450.
Target: 570 – 620, structurally projected by measuring the height of the prior macro uptrend visible on the chart and adding it to the box breakout level.
Stop Loss: A strict stop loss should be placed slightly below the critical 383.20 green support line (e.g., a weekly close below 375) to invalidate the trade if the price structurally fails and falls back through the consolidation floor.
Previously, the price successfully cleared a major historical resistance line distinctly marked at 383.20. After this initial breakout, the stock spent several weeks consolidating within a defined rectangular zone (highlighted by the pink box) between the 383.20 support floor and a resistance ceiling near 450.
The most recent weekly candle has registered a powerful breakout above this consolidation box, closing near the absolute high of the week at 476.70, which represents a 12.50% gain.
This structural shift, combined with the rising volume bars visible at the bottom of the chart during the breakout, signals that buyers have regained full control to initiate the next leg of the primary uptrend.
Entry Point: The current market price around 476.70 offers a primary entry, with a secondary accumulation zone on any minor retest of the upper boundary of the pink box near 450.
Target: 570 – 620, structurally projected by measuring the height of the prior macro uptrend visible on the chart and adding it to the box breakout level.
Stop Loss: A strict stop loss should be placed slightly below the critical 383.20 green support line (e.g., a weekly close below 375) to invalidate the trade if the price structurally fails and falls back through the consolidation floor.
Сделка закрыта: достигнута стоп-лосс цена
Stop-Loss Hit..
Отказ от ответственности
Информация и публикации не предназначены для предоставления и не являются финансовыми, инвестиционными, торговыми или другими видами советов или рекомендаций, предоставленных или одобренных TradingView. Подробнее читайте в Условиях использования.
Отказ от ответственности
Информация и публикации не предназначены для предоставления и не являются финансовыми, инвестиционными, торговыми или другими видами советов или рекомендаций, предоставленных или одобренных TradingView. Подробнее читайте в Условиях использования.