
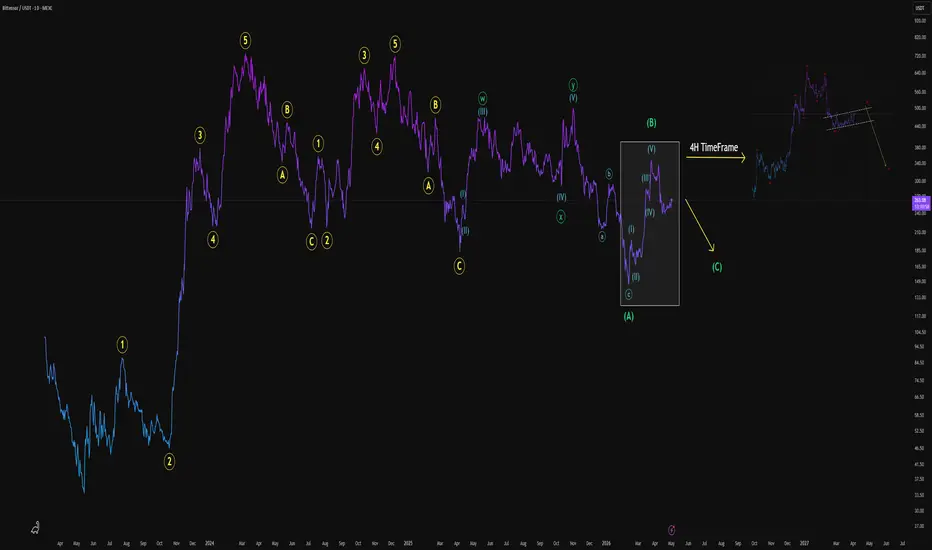
Here is a clear Elliott Wave projection for TAO/USDT.
The daily chart shows ongoing downtrend pressure. Shorter timeframes suggest that the current inner wave for TAO is wave 4, and the final wave hasn't even started yet.
When analyzing both larger and shorter timeframes together, both suggest that the downtrend is still on the table.
Lower Timeframe Looks like This:

Wave 4 on the 4H timeframe is signaling a triangle formation, similar to a channel. The inner wave count for the triangle suggests that the main waves (A-B-C-D-E) haven't finished yet. Currently, the price should be around sub-wave E, which is the last wave of the triangle and might extend further than shown on the chart. This is normal as long as a character shift (CHoCH) does not occur.
On the daily timeframe, I didn't mark every inner wave to avoid confusing the audience; we can simply identify them as impulse-correction (1-5 / A-C).
Currently, a "double three" formation is appearing on the horizon in larger timeframes. TAO might be at the very end of it. It will likely take time to develop, so it's not the ideal moment to enter a buying position.
Thx for reading.
Skyress.
The daily chart shows ongoing downtrend pressure. Shorter timeframes suggest that the current inner wave for TAO is wave 4, and the final wave hasn't even started yet.
When analyzing both larger and shorter timeframes together, both suggest that the downtrend is still on the table.
Lower Timeframe Looks like This:
Wave 4 on the 4H timeframe is signaling a triangle formation, similar to a channel. The inner wave count for the triangle suggests that the main waves (A-B-C-D-E) haven't finished yet. Currently, the price should be around sub-wave E, which is the last wave of the triangle and might extend further than shown on the chart. This is normal as long as a character shift (CHoCH) does not occur.
On the daily timeframe, I didn't mark every inner wave to avoid confusing the audience; we can simply identify them as impulse-correction (1-5 / A-C).
Currently, a "double three" formation is appearing on the horizon in larger timeframes. TAO might be at the very end of it. It will likely take time to develop, so it's not the ideal moment to enter a buying position.
Thx for reading.
Skyress.

Отказ от ответственности
Информация и публикации не предназначены для предоставления и не являются финансовыми, инвестиционными, торговыми или другими видами советов или рекомендаций, предоставленных или одобренных TradingView. Подробнее читайте в Условиях использования.
Отказ от ответственности
Информация и публикации не предназначены для предоставления и не являются финансовыми, инвестиционными, торговыми или другими видами советов или рекомендаций, предоставленных или одобренных TradingView. Подробнее читайте в Условиях использования.