
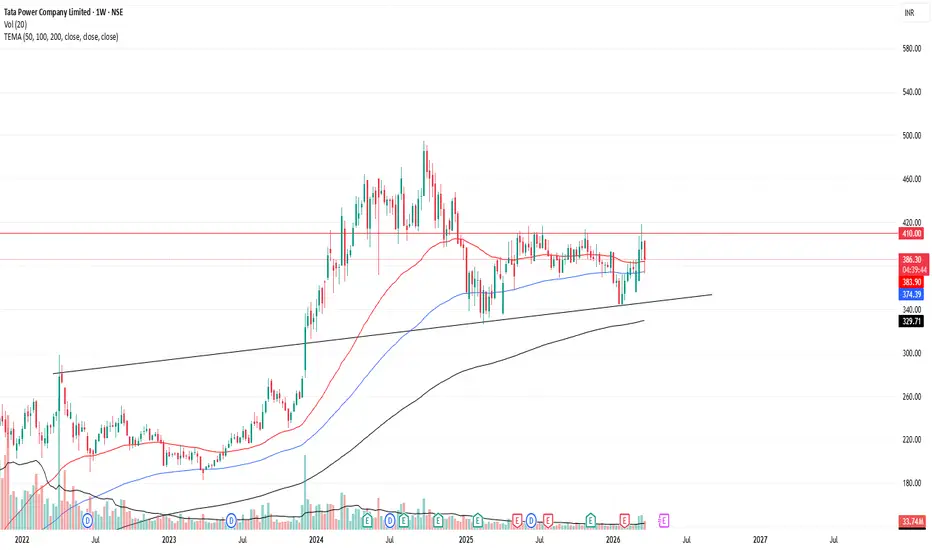
Chart View (Weekly Timeframe)
Price is consolidating between ₹370–₹410
Strong resistance around ₹410–₹420
Support zone near ₹350–₹360
Price is trading:
Around 50 EMA (short-term control)
Above 100 & 200 EMA → long-term uptrend intact
Forming a Double Bottom formation
Structure:
Big rally → Distribution → Now range accumulation
👉 This looks like a base-building phase after a strong uptrend
Bullish Scenario (High Probability if breakout comes)
Weekly close above ₹410
Target zones:
₹450 (previous supply)
₹500+ (trend continuation)
➡️ This will confirm range breakout + continuation of primary uptrend
Fundamental Trigger – Power Demand Explosion
India’s power demand is massively rising, which is a big structural tailwind:
Peak demand expected to hit ~270 GW in 2026 (record high)
Long-term demand may reach 459 GW by 2036
Electricity consumption growing ~6–6.5% annually
👉 This is not a short-term story — it's a decade-long growth cycle
Key highlights:
Government ordered Tata Power’s 4 GW Mundra plant to run at full capacity to meet summer demand
New power purchase agreements (PPAs) signed → stable revenue visibility
India nearing 24x7 electricity supply with strong infra push
Rising demand due to heatwaves + industrial growth
👉 Even coal plants are being restarted → shows real demand pressure
Demand Drivers (Why Power Stocks Can Outperform)
🏭 Industrial consumption = ~43% of total demand
🧠 Data centers demand exploding (AI boom)
🚗 EV adoption increasing electricity load
☀️ Renewable capacity growing rapidly (solar + wind)
Conclusion
Technical: Range-bound, waiting for breakout
Fundamental: Extremely strong long-term demand
Trigger: ₹410 breakout can lead to sharp upside
👉 Tata Power is a "structure + story" stock right now
Disclaimer - This is for educational purpose only. Take financial advise from your financial advisor before investing.
Price is consolidating between ₹370–₹410
Strong resistance around ₹410–₹420
Support zone near ₹350–₹360
Price is trading:
Around 50 EMA (short-term control)
Above 100 & 200 EMA → long-term uptrend intact
Forming a Double Bottom formation
Structure:
Big rally → Distribution → Now range accumulation
👉 This looks like a base-building phase after a strong uptrend
Bullish Scenario (High Probability if breakout comes)
Weekly close above ₹410
Target zones:
₹450 (previous supply)
₹500+ (trend continuation)
➡️ This will confirm range breakout + continuation of primary uptrend
Fundamental Trigger – Power Demand Explosion
India’s power demand is massively rising, which is a big structural tailwind:
Peak demand expected to hit ~270 GW in 2026 (record high)
Long-term demand may reach 459 GW by 2036
Electricity consumption growing ~6–6.5% annually
👉 This is not a short-term story — it's a decade-long growth cycle
Key highlights:
Government ordered Tata Power’s 4 GW Mundra plant to run at full capacity to meet summer demand
New power purchase agreements (PPAs) signed → stable revenue visibility
India nearing 24x7 electricity supply with strong infra push
Rising demand due to heatwaves + industrial growth
👉 Even coal plants are being restarted → shows real demand pressure
Demand Drivers (Why Power Stocks Can Outperform)
🏭 Industrial consumption = ~43% of total demand
🧠 Data centers demand exploding (AI boom)
🚗 EV adoption increasing electricity load
☀️ Renewable capacity growing rapidly (solar + wind)
Conclusion
Technical: Range-bound, waiting for breakout
Fundamental: Extremely strong long-term demand
Trigger: ₹410 breakout can lead to sharp upside
👉 Tata Power is a "structure + story" stock right now
Disclaimer - This is for educational purpose only. Take financial advise from your financial advisor before investing.
Сделка закрыта: достигнута тейк-профит цена
1ST TARGET ACHIEVED. 
Отказ от ответственности
Информация и публикации не предназначены для предоставления и не являются финансовыми, инвестиционными, торговыми или другими видами советов или рекомендаций, предоставленных или одобренных TradingView. Подробнее читайте в Условиях использования.
Отказ от ответственности
Информация и публикации не предназначены для предоставления и не являются финансовыми, инвестиционными, торговыми или другими видами советов или рекомендаций, предоставленных или одобренных TradingView. Подробнее читайте в Условиях использования.