
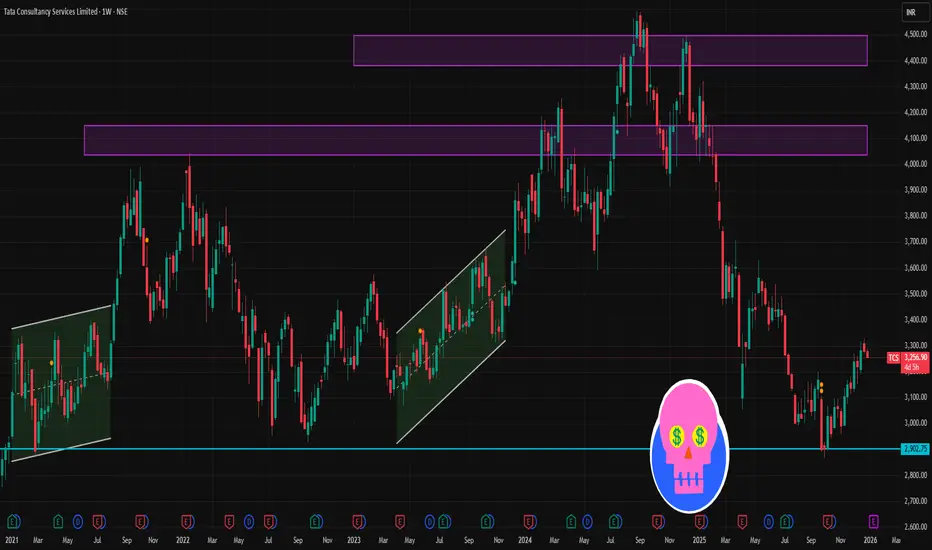
📊 Current Price Context
TCS is trading around ₹3,260–₹3,280 on NSE.
The stock continues to consolidate in a sideways range, showing mixed momentum.
🎯 Key Levels — 1‑Week View (Support & Resistance)
🟦 Support Zones
Immediate Support: ~₹3,258–₹3,260 (near current intraday lows) — break below here signals weakness.
Secondary Support: ~₹3,236–₹3,242 — if price closes below this, broader selling could accelerate.
🟥 Resistance Zones
Immediate Resistance: ~₹3,310–₹3,315 — this is the first supply area the market needs to clear.
Upside Breakout Target: ~₹3,350 — clearing and holding above this could shift the short‑term bias bullish.
📌 Summary of Levels
Level Type Price Zone Interpretation
Immediate Support ₹3,258–3,260 Short‑term bulls must hold
Secondary Support ₹3,236–3,242 Key breakdown trigger
Immediate Resistance ₹3,310–3,315 First upside hurdle
Breakout Resistance ₹3,350+ Bullish continuation zone
📌 Short‑Term Trader Notes
Use closing prices (not just intraday levels) to confirm breaks of support/resistance.
Watch for volume spikes near support or resistance to validate breakouts or breakdowns.
RSI and MACD remain useful to spot divergence signals (oversold/overbought).
TCS is trading around ₹3,260–₹3,280 on NSE.
The stock continues to consolidate in a sideways range, showing mixed momentum.
🎯 Key Levels — 1‑Week View (Support & Resistance)
🟦 Support Zones
Immediate Support: ~₹3,258–₹3,260 (near current intraday lows) — break below here signals weakness.
Secondary Support: ~₹3,236–₹3,242 — if price closes below this, broader selling could accelerate.
🟥 Resistance Zones
Immediate Resistance: ~₹3,310–₹3,315 — this is the first supply area the market needs to clear.
Upside Breakout Target: ~₹3,350 — clearing and holding above this could shift the short‑term bias bullish.
📌 Summary of Levels
Level Type Price Zone Interpretation
Immediate Support ₹3,258–3,260 Short‑term bulls must hold
Secondary Support ₹3,236–3,242 Key breakdown trigger
Immediate Resistance ₹3,310–3,315 First upside hurdle
Breakout Resistance ₹3,350+ Bullish continuation zone
📌 Short‑Term Trader Notes
Use closing prices (not just intraday levels) to confirm breaks of support/resistance.
Watch for volume spikes near support or resistance to validate breakouts or breakdowns.
RSI and MACD remain useful to spot divergence signals (oversold/overbought).

Contact Knowledgehub for a detailed consultation: Dm on WhatsApp: [wa.link/a2o0kz]-
Phone No: [+91 93102 26243]-
Email: [tradingviewknowledgehub@gmail.com]---
-- Let’s achieve success together!
Phone No: [+91 93102 26243]-
Email: [tradingviewknowledgehub@gmail.com]---
-- Let’s achieve success together!
Похожие публикации
Отказ от ответственности
Информация и публикации не предназначены для предоставления и не являются финансовыми, инвестиционными, торговыми или другими видами советов или рекомендаций, предоставленных или одобренных TradingView. Подробнее читайте в Условиях использования.
Contact Knowledgehub for a detailed consultation: Dm on WhatsApp: [wa.link/a2o0kz]-
Phone No: [+91 93102 26243]-
Email: [tradingviewknowledgehub@gmail.com]---
-- Let’s achieve success together!
Phone No: [+91 93102 26243]-
Email: [tradingviewknowledgehub@gmail.com]---
-- Let’s achieve success together!
Похожие публикации
Отказ от ответственности
Информация и публикации не предназначены для предоставления и не являются финансовыми, инвестиционными, торговыми или другими видами советов или рекомендаций, предоставленных или одобренных TradingView. Подробнее читайте в Условиях использования.