TCT falling wedge
#TCTBTC
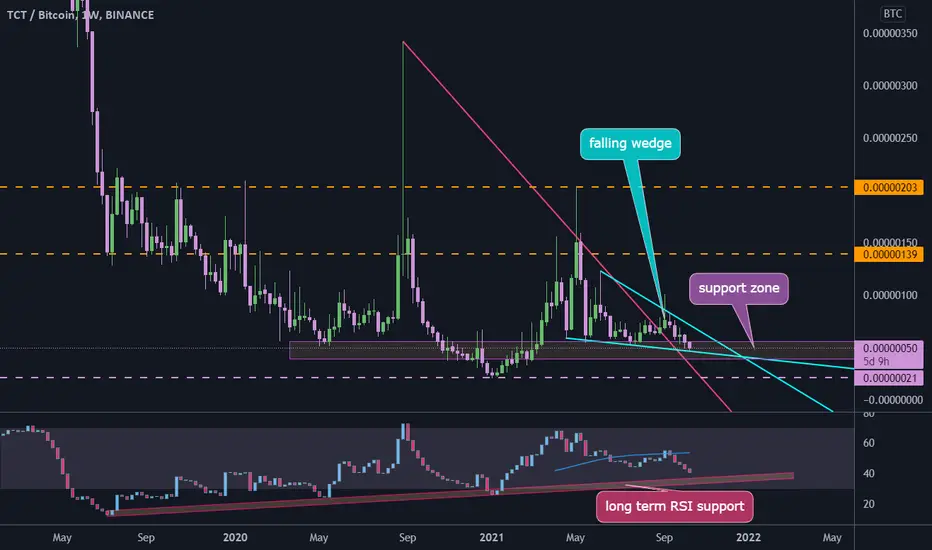
#TCT with BTC pair shows a falling wedge pattern in daily time frame, we can see that price broke out from descending resistance line and going down near this line, there is a long term support zone in RSI that shows price may fall more to touch it one more time then head up and break the wedge pattern.
#TCT with BTC pair shows a falling wedge pattern in daily time frame, we can see that price broke out from descending resistance line and going down near this line, there is a long term support zone in RSI that shows price may fall more to touch it one more time then head up and break the wedge pattern.

Отказ от ответственности
Информация и публикации не предназначены для предоставления и не являются финансовыми, инвестиционными, торговыми или другими видами советов или рекомендаций, предоставленных или одобренных TradingView. Подробнее читайте в Условиях использования.
Отказ от ответственности
Информация и публикации не предназначены для предоставления и не являются финансовыми, инвестиционными, торговыми или другими видами советов или рекомендаций, предоставленных или одобренных TradingView. Подробнее читайте в Условиях использования.