
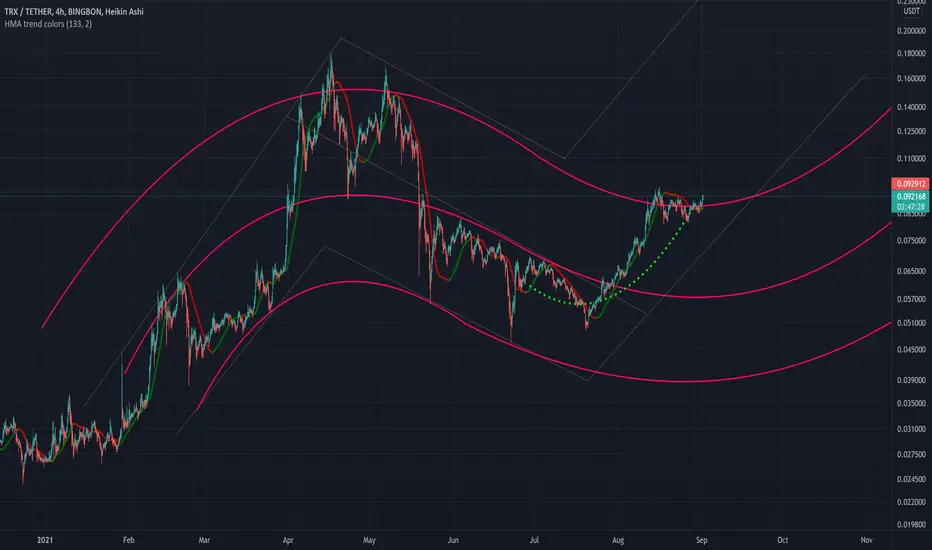
Same untouched chart I published on Jun 28
Will bulls break up?
This is a curved projection channel created upon a bounding box. The chart is presented over a LOG price scale. For its creation we use 3 "curved line boundaries" that cover the center, upper and lower limits for potential movement. Even if this not an attempt to forecast a trend or future scenario, it allows to have an easy to read view of probable limits and oscillation parameters.
Just sharing my personal charts for learning purposes only. This is not an investment recommendation.
Will bulls break up?
This is a curved projection channel created upon a bounding box. The chart is presented over a LOG price scale. For its creation we use 3 "curved line boundaries" that cover the center, upper and lower limits for potential movement. Even if this not an attempt to forecast a trend or future scenario, it allows to have an easy to read view of probable limits and oscillation parameters.
Just sharing my personal charts for learning purposes only. This is not an investment recommendation.
Заметка
This was the original chart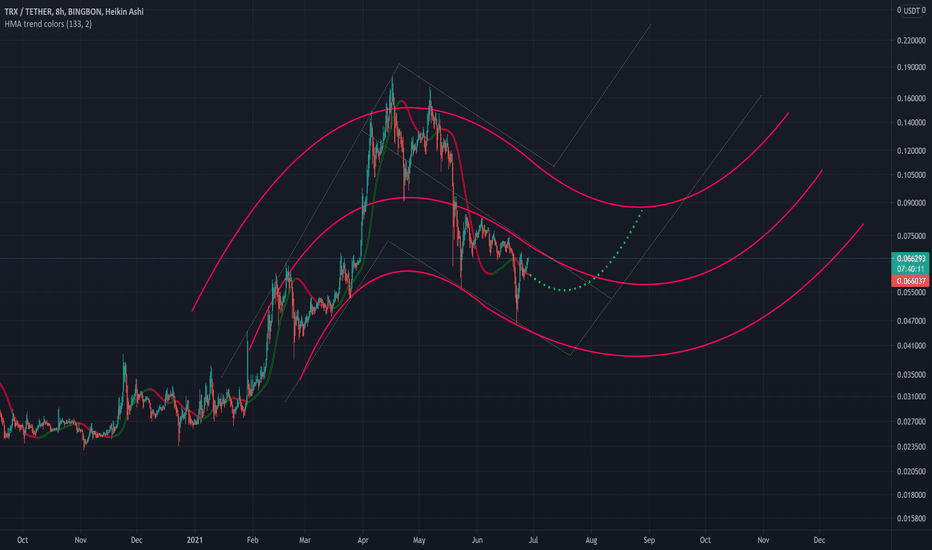

Отказ от ответственности
Информация и публикации не предназначены для предоставления и не являются финансовыми, инвестиционными, торговыми или другими видами советов или рекомендаций, предоставленных или одобренных TradingView. Подробнее читайте в Условиях использования.
Отказ от ответственности
Информация и публикации не предназначены для предоставления и не являются финансовыми, инвестиционными, торговыми или другими видами советов или рекомендаций, предоставленных или одобренных TradingView. Подробнее читайте в Условиях использования.