
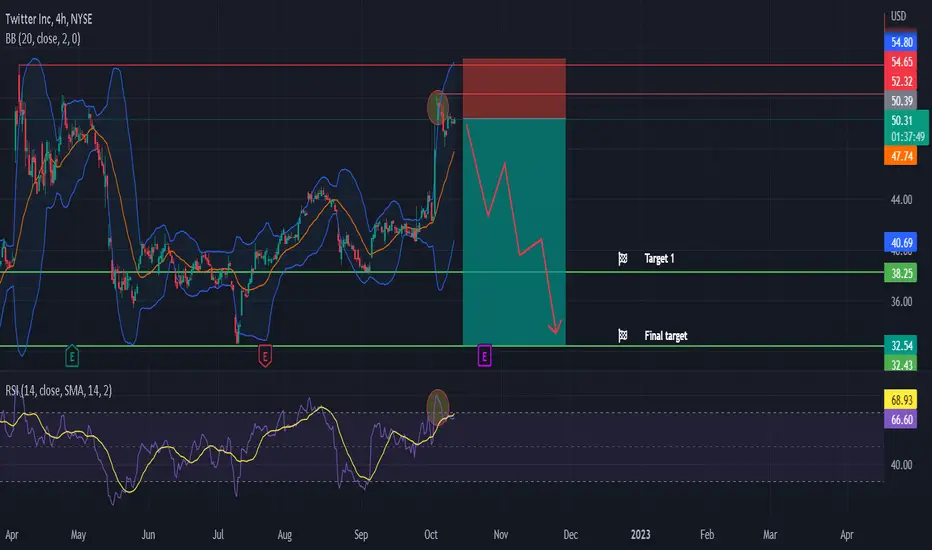
Looking at Twitter the chart shows that it´s overbought and is likely to go down.
Following the Bollinger Bands we see the price has touched and moved out of the upper band. Following the RSI 14 we see that the RSI went above 70. So both indicators are indicating a move to the downside.
According to the earning announcement we expect it will be towards the downside as well.
Targets and further details are shown in the chart.
Good luck!
Following the Bollinger Bands we see the price has touched and moved out of the upper band. Following the RSI 14 we see that the RSI went above 70. So both indicators are indicating a move to the downside.
According to the earning announcement we expect it will be towards the downside as well.
Targets and further details are shown in the chart.
Good luck!

💥 Free signals and ideas ➡ t.me/vfinvestment
Похожие публикации
Отказ от ответственности
Информация и публикации не предназначены для предоставления и не являются финансовыми, инвестиционными, торговыми или другими видами советов или рекомендаций, предоставленных или одобренных TradingView. Подробнее читайте в Условиях использования.
💥 Free signals and ideas ➡ t.me/vfinvestment
Похожие публикации
Отказ от ответственности
Информация и публикации не предназначены для предоставления и не являются финансовыми, инвестиционными, торговыми или другими видами советов или рекомендаций, предоставленных или одобренных TradingView. Подробнее читайте в Условиях использования.