
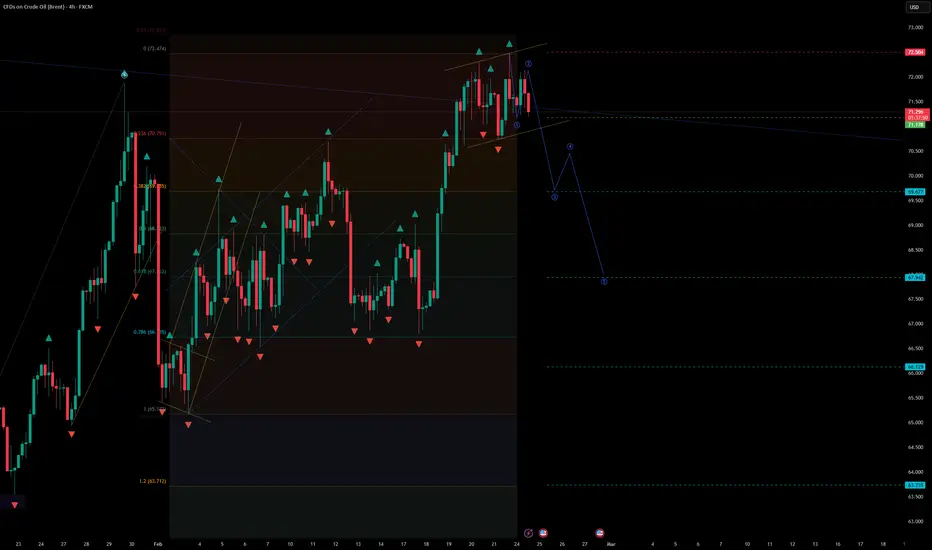
Brent Crude Oil (UKOIL) — H4 Formation of a Potential Wave 3 + Trendline Break (Bearish Continuation)
🔎 Market Structure (H4)
On the H4 timeframe, Brent has formed the technical conditions for a bearish continuation through the development of a potential Wave 3 to the downside, confirmed by:
a breakout below the corrective trendline (structure shift)
completion of the pullback phase (Wave 2) after the initial bearish leg
rejection from the upper boundary of the corrective range near local resistance
loss of short-term bullish momentum and transition back into selling pressure
This aligns with a classic Elliott Wave continuation model, where Wave 3 often begins after price exits a corrective structure and resumes the dominant direction.
📐 Elliott Wave Context
Wave 1: initial impulsive decline (trend initiation)
Wave 2: corrective retracement into resistance / structure top
Wave 3: expected impulsive expansion lower (current scenario)
📌 Key principle:
The bearish scenario remains valid as long as price stays below the high of Wave 1.
📍 Entry
Entry: 71.178
The entry is positioned:
below the broken trendline (breakdown confirmation zone)
inside the impulse activation area after the corrective structure failed
aligned with continuation momentum rather than a reversal attempt
🎯 Target Levels (Wave 3 Projections)
Targets are derived from projected impulse expansion zones and key reaction levels:
TP1: 69.677
TP2: 67.942
TP3: 66.129
TP4: 63.735
Each target represents a potential reaction zone and a logical level for partial profit-taking as Wave 3 develops.
🛑 Invalidation / Stop Loss
Stop Loss: 72.504
📍 The stop is placed above the high of Wave 1, which:
invalidates the Wave 3 bearish scenario if breached
protects against a shift into an alternative bullish structure
follows Elliott Wave risk logic (stop beyond the key swing)
🧠 Risk & Trade Management
Trend-following setup
Wave 3 can be strong but volatile once acceleration starts.
Recommended approach:
partial profits at TP1 / TP2
move stop to breakeven after a clean impulsive continuation is confirmed
avoid increasing risk early — add only on intrawave pullbacks within Wave 3
confirmation improves if price holds below the broken trendline and continues with strong bearish candles
📌 Summary
Brent on H4 shows a corrective trendline break and a completed pullback phase, supporting the start of a potential Wave 3 to the downside.
The bearish scenario remains valid below 72.504, with downside targets at 69.677 → 67.942 → 66.129 → 63.735.
🔎 Market Structure (H4)
On the H4 timeframe, Brent has formed the technical conditions for a bearish continuation through the development of a potential Wave 3 to the downside, confirmed by:
a breakout below the corrective trendline (structure shift)
completion of the pullback phase (Wave 2) after the initial bearish leg
rejection from the upper boundary of the corrective range near local resistance
loss of short-term bullish momentum and transition back into selling pressure
This aligns with a classic Elliott Wave continuation model, where Wave 3 often begins after price exits a corrective structure and resumes the dominant direction.
📐 Elliott Wave Context
Wave 1: initial impulsive decline (trend initiation)
Wave 2: corrective retracement into resistance / structure top
Wave 3: expected impulsive expansion lower (current scenario)
📌 Key principle:
The bearish scenario remains valid as long as price stays below the high of Wave 1.
📍 Entry
Entry: 71.178
The entry is positioned:
below the broken trendline (breakdown confirmation zone)
inside the impulse activation area after the corrective structure failed
aligned with continuation momentum rather than a reversal attempt
🎯 Target Levels (Wave 3 Projections)
Targets are derived from projected impulse expansion zones and key reaction levels:
TP1: 69.677
TP2: 67.942
TP3: 66.129
TP4: 63.735
Each target represents a potential reaction zone and a logical level for partial profit-taking as Wave 3 develops.
🛑 Invalidation / Stop Loss
Stop Loss: 72.504
📍 The stop is placed above the high of Wave 1, which:
invalidates the Wave 3 bearish scenario if breached
protects against a shift into an alternative bullish structure
follows Elliott Wave risk logic (stop beyond the key swing)
🧠 Risk & Trade Management
Trend-following setup
Wave 3 can be strong but volatile once acceleration starts.
Recommended approach:
partial profits at TP1 / TP2
move stop to breakeven after a clean impulsive continuation is confirmed
avoid increasing risk early — add only on intrawave pullbacks within Wave 3
confirmation improves if price holds below the broken trendline and continues with strong bearish candles
📌 Summary
Brent on H4 shows a corrective trendline break and a completed pullback phase, supporting the start of a potential Wave 3 to the downside.
The bearish scenario remains valid below 72.504, with downside targets at 69.677 → 67.942 → 66.129 → 63.735.

Отказ от ответственности
Информация и публикации не предназначены для предоставления и не являются финансовыми, инвестиционными, торговыми или другими видами советов или рекомендаций, предоставленных или одобренных TradingView. Подробнее читайте в Условиях использования.
Отказ от ответственности
Информация и публикации не предназначены для предоставления и не являются финансовыми, инвестиционными, торговыми или другими видами советов или рекомендаций, предоставленных или одобренных TradingView. Подробнее читайте в Условиях использования.