
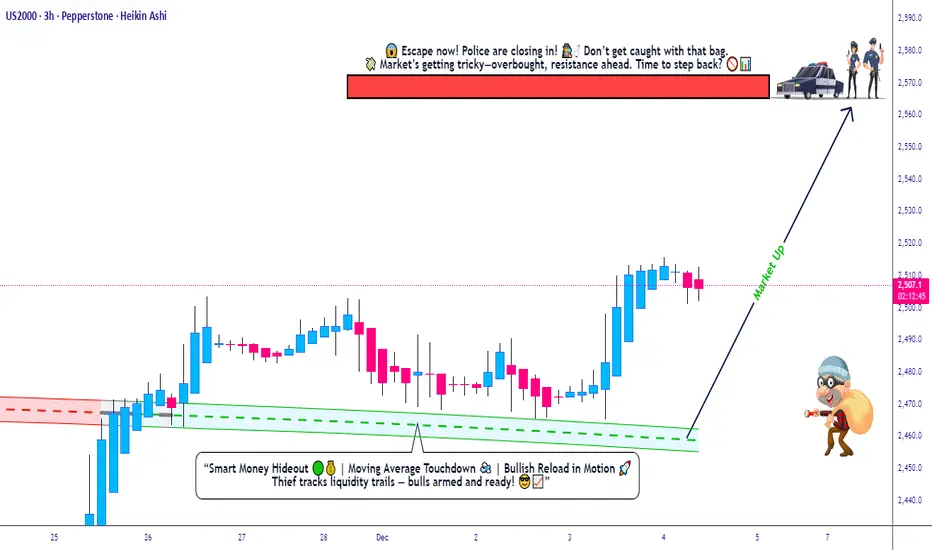
🚀 US2000 Bullish Setup – Triangular MA Pullback Play (Layered Entry Blueprint) 🚀
✨ Asset: US2000 – Small-Cap U.S. Index
📅 Trade Style: Day / Swing
🎯 Bias: Bullish Continuation confirmed through Triangular Moving Average Pullback
📌 Trade Plan – Clean & Clear
📈 Bullish Structure Confirmed
The price retest on the Triangular Moving Average shows buyers stepping in aggressively, signalling a strong continuation phase. This is where momentum traders and swing players gain the best advantage.
🧠 Thief Strategy – Layered Limit Entries (Multi-Order Method)
To manage volatility + trap liquidity like a pro, we use layered buy limits.
🔽 Buy Limit Layers (Flexible Based on Your Style):
2470
2480
2490
2500
(Feel free to add more layers based on your own capital, risk model, or spread environment.)
This layered technique helps you:
⚡ Catch deeper pullbacks
⚡ Reduce average entry cost
⚡ Beat market whipsaws
⚡ Accumulate position silently like a true OG
🛑 Stop Loss – Safety First
SL: 2450
Dear Ladies & Gentlemen (Thief OGs), adjust this SL as per your strategy, risk appetite, and volatility conditions.
This is not a forced SL — your account, your rules.
🎯 Target – Exit with Profits, Not with Ego
Our take-profit sits near:
TP: 2570
Why?
🔼 Moving averages above are acting as a strong dynamic resistance zone
🔼 Market nearing overbought territory
🔼 Potential bull trap zone, so escape elegantly with profits
Again, OGs — your TP is your own choice. Manage your bag with discipline.
📊 Market Psychology & Structure Insight
The US2000 typically reacts faster to sentiment compared to big indices like SPX or NASDAQ because small-caps absorb liquidity shocks quicker.
This bullish pullback presents a classic “buy the dip into MA” play — a favourite among swing traders.
🌐 Related Pairs To Watch (Correlation Keynotes)
💵 SPX /
SPX /  SPY (S&P 500)
Strong positive correlation
If SPX is bullish, US2000 usually follows with stronger momentum
Watch SPX’s 4H trend for confirmation
📈 NDX /
NDX /  QQQ (NASDAQ 100)
When tech rallies, small-caps often catch delayed momentum
A strong NASDAQ risk-on pulse boosts US2000 sentiment
📉 DXY (U.S. Dollar Index)
Inverse correlation
Weak DXY boosts equities (US2000 included)
If DXY drops, small-cap indices often pump harder
 VIX (Volatility Index)
Direct risk-sentiment indicator
Falling VIX = bullish for US2000
Rising VIX = be cautious with new entries
💼 DJI (Dow Jones)
Large caps lead in stability
When Dow is stable/bullish → risk-on spillover increases small-cap flows
📝 Final Thought
This setup suits traders who love structured pullbacks, clean MA-based momentum, and layered entries. Manage risk, scale smart, and take profit with intention — not emotion.
✨ Asset: US2000 – Small-Cap U.S. Index
📅 Trade Style: Day / Swing
🎯 Bias: Bullish Continuation confirmed through Triangular Moving Average Pullback
📌 Trade Plan – Clean & Clear
📈 Bullish Structure Confirmed
The price retest on the Triangular Moving Average shows buyers stepping in aggressively, signalling a strong continuation phase. This is where momentum traders and swing players gain the best advantage.
🧠 Thief Strategy – Layered Limit Entries (Multi-Order Method)
To manage volatility + trap liquidity like a pro, we use layered buy limits.
🔽 Buy Limit Layers (Flexible Based on Your Style):
2470
2480
2490
2500
(Feel free to add more layers based on your own capital, risk model, or spread environment.)
This layered technique helps you:
⚡ Catch deeper pullbacks
⚡ Reduce average entry cost
⚡ Beat market whipsaws
⚡ Accumulate position silently like a true OG
🛑 Stop Loss – Safety First
SL: 2450
Dear Ladies & Gentlemen (Thief OGs), adjust this SL as per your strategy, risk appetite, and volatility conditions.
This is not a forced SL — your account, your rules.
🎯 Target – Exit with Profits, Not with Ego
Our take-profit sits near:
TP: 2570
Why?
🔼 Moving averages above are acting as a strong dynamic resistance zone
🔼 Market nearing overbought territory
🔼 Potential bull trap zone, so escape elegantly with profits
Again, OGs — your TP is your own choice. Manage your bag with discipline.
📊 Market Psychology & Structure Insight
The US2000 typically reacts faster to sentiment compared to big indices like SPX or NASDAQ because small-caps absorb liquidity shocks quicker.
This bullish pullback presents a classic “buy the dip into MA” play — a favourite among swing traders.
🌐 Related Pairs To Watch (Correlation Keynotes)
💵
SPX / SPY (S&P 500)Strong positive correlation
If SPX is bullish, US2000 usually follows with stronger momentum
Watch SPX’s 4H trend for confirmation
📈
NDX / QQQ (NASDAQ 100)When tech rallies, small-caps often catch delayed momentum
A strong NASDAQ risk-on pulse boosts US2000 sentiment
📉
DXY (U.S. Dollar Index)Inverse correlation
Weak DXY boosts equities (US2000 included)
If DXY drops, small-cap indices often pump harder
VIX (Volatility Index)Direct risk-sentiment indicator
Falling VIX = bullish for US2000
Rising VIX = be cautious with new entries
💼
DJI (Dow Jones)Large caps lead in stability
When Dow is stable/bullish → risk-on spillover increases small-cap flows
📝 Final Thought
This setup suits traders who love structured pullbacks, clean MA-based momentum, and layered entries. Manage risk, scale smart, and take profit with intention — not emotion.

Похожие публикации
Отказ от ответственности
Информация и публикации не предназначены для предоставления и не являются финансовыми, инвестиционными, торговыми или другими видами советов или рекомендаций, предоставленных или одобренных TradingView. Подробнее читайте в Условиях использования.
Похожие публикации
Отказ от ответственности
Информация и публикации не предназначены для предоставления и не являются финансовыми, инвестиционными, торговыми или другими видами советов или рекомендаций, предоставленных или одобренных TradingView. Подробнее читайте в Условиях использования.