
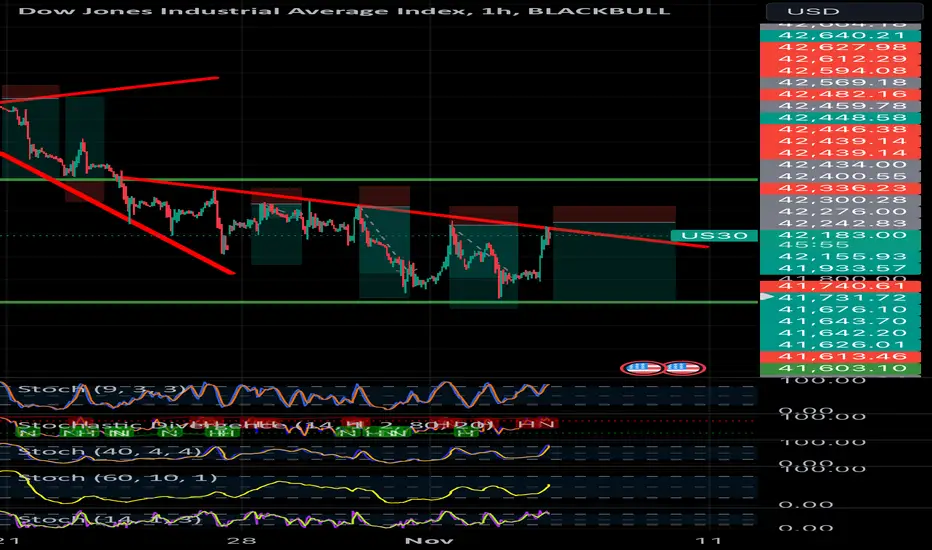
US30 Sell Technical Analysis
The US30 Dow Jones Industrial Average is currently showing a downtrend on the 1-hour chart, as evidenced by the descending trendline and multiple failed attempts to break above resistance. The Stochastic indicators also suggest overbought conditions, with the potential for a downward movement as momentum appears to be weakening. Additionally, previous rejections at the resistance zone highlight seller dominance in this range. A break below the support levels could accelerate selling pressure, making it a favorable setup for a short position.
The US30 Dow Jones Industrial Average is currently showing a downtrend on the 1-hour chart, as evidenced by the descending trendline and multiple failed attempts to break above resistance. The Stochastic indicators also suggest overbought conditions, with the potential for a downward movement as momentum appears to be weakening. Additionally, previous rejections at the resistance zone highlight seller dominance in this range. A break below the support levels could accelerate selling pressure, making it a favorable setup for a short position.

Отказ от ответственности
Информация и публикации не предназначены для предоставления и не являются финансовыми, инвестиционными, торговыми или другими видами советов или рекомендаций, предоставленных или одобренных TradingView. Подробнее читайте в Условиях использования.
Отказ от ответственности
Информация и публикации не предназначены для предоставления и не являются финансовыми, инвестиционными, торговыми или другими видами советов или рекомендаций, предоставленных или одобренных TradingView. Подробнее читайте в Условиях использования.