
The DJ recovered from the sell-off thanks to Pentagon-driven buy
Market Analysis
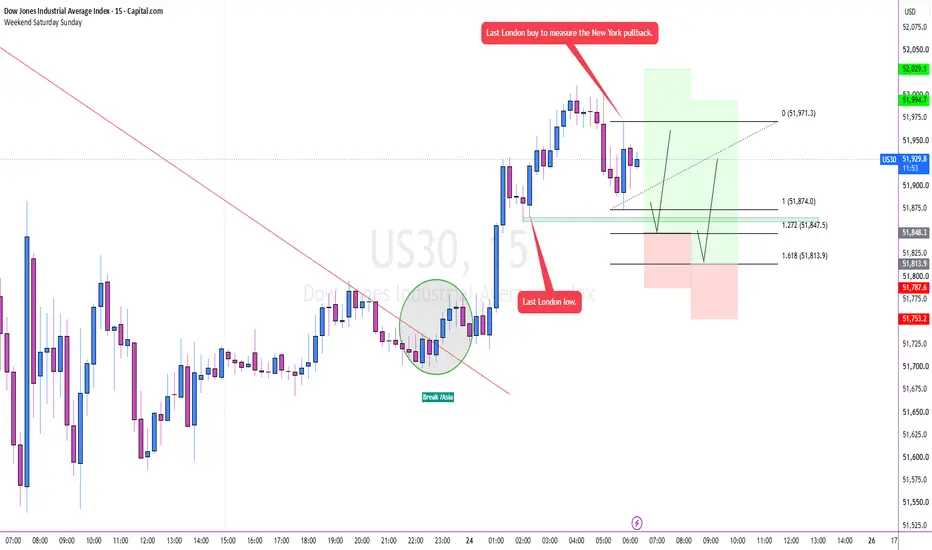
The overall market has maintained a bearish sentiment, with the latest downtrend extending for nearly two consecutive trading days. However, this bearish structure was broken during today's Asian session, suggesting that sellers may be losing momentum.
During the London session, price formed a strong bullish engulfing candle, reinforcing the possibility of a short-term shift in market direction. Based on this price action, I expect the New York session to continue developing the bullish move while seeking liquidity.
To identify potential buy zones, I measured London's most recent bullish leg to estimate the maximum depth of a New York pullback. My primary areas of interest are the 1.27 and 1.61 Fibonacci extension levels, where I will look for confirmation before entering long positions.
Additionally, today's market sentiment has been supported by news indicating a recovery in AI-related companies. This adds confluence to the bullish outlook, making these liquidity zones attractive areas to search for buying opportunities.
Trading Bias: Bullish
Key Levels: Fibonacci 1.27 and 1.61
Session Focus: New York
Primary Objective: Wait for the pullback into liquidity before looking for long confirmations.
-------------------------------
-The entry must be taken within a maximum of 3 hours; otherwise, for me, it no longer has enough strength.
- 1% total risk on the entry if both points are triggered, taking 0.5% risk on each Fibonacci level.
- Trade 1:3 with a 60-pip stop loss and a 180-pip take profit.
--------------------------------
The overall market has maintained a bearish sentiment, with the latest downtrend extending for nearly two consecutive trading days. However, this bearish structure was broken during today's Asian session, suggesting that sellers may be losing momentum.
During the London session, price formed a strong bullish engulfing candle, reinforcing the possibility of a short-term shift in market direction. Based on this price action, I expect the New York session to continue developing the bullish move while seeking liquidity.
To identify potential buy zones, I measured London's most recent bullish leg to estimate the maximum depth of a New York pullback. My primary areas of interest are the 1.27 and 1.61 Fibonacci extension levels, where I will look for confirmation before entering long positions.
Additionally, today's market sentiment has been supported by news indicating a recovery in AI-related companies. This adds confluence to the bullish outlook, making these liquidity zones attractive areas to search for buying opportunities.
Trading Bias: Bullish
Key Levels: Fibonacci 1.27 and 1.61
Session Focus: New York
Primary Objective: Wait for the pullback into liquidity before looking for long confirmations.
-------------------------------
-The entry must be taken within a maximum of 3 hours; otherwise, for me, it no longer has enough strength.
- 1% total risk on the entry if both points are triggered, taking 0.5% risk on each Fibonacci level.
- Trade 1:3 with a 60-pip stop loss and a 180-pip take profit.
--------------------------------

Отказ от ответственности
Информация и публикации не предназначены для предоставления и не являются финансовыми, инвестиционными, торговыми или другими видами советов или рекомендаций, предоставленных или одобренных TradingView. Подробнее читайте в Условиях использования.
Отказ от ответственности
Информация и публикации не предназначены для предоставления и не являются финансовыми, инвестиционными, торговыми или другими видами советов или рекомендаций, предоставленных или одобренных TradingView. Подробнее читайте в Условиях использования.