
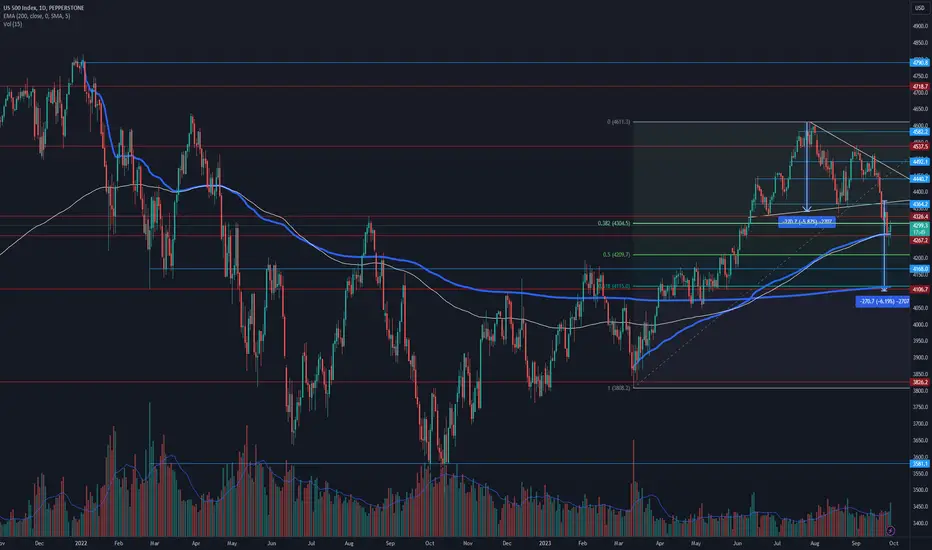
Here's what I'm looking at.
I still think $4100 is on the table for a bottom. Reason being, there's multiple levels of confluence there.
1) If you take the AVWAP from the Jan 2022 highs, it comes to around $4100
2) It's a horizontal level
3) It's roughly the measured objective of the Head and Shoulders break down
4) It's also coming in around the 0.618 fib level.
Of course there will be levels of support along the way, one being the current $4260 area.
This $4260 area is also a confluence of support with
1) It's a horizontal level on the weekly
2) The 200EMA on the Daily chart
3) The AVWAP from the recent March 2023 lows.
Either we see a bounce and recovery from here ($4260 area) or if we break lower we'll see 4100.
For now, I still think $4100 may be the low for this correction.

Отказ от ответственности
Информация и публикации не предназначены для предоставления и не являются финансовыми, инвестиционными, торговыми или другими видами советов или рекомендаций, предоставленных или одобренных TradingView. Подробнее читайте в Условиях использования.
Отказ от ответственности
Информация и публикации не предназначены для предоставления и не являются финансовыми, инвестиционными, торговыми или другими видами советов или рекомендаций, предоставленных или одобренных TradingView. Подробнее читайте в Условиях использования.