

Hi, new trader here. I'm trading on a naked chart
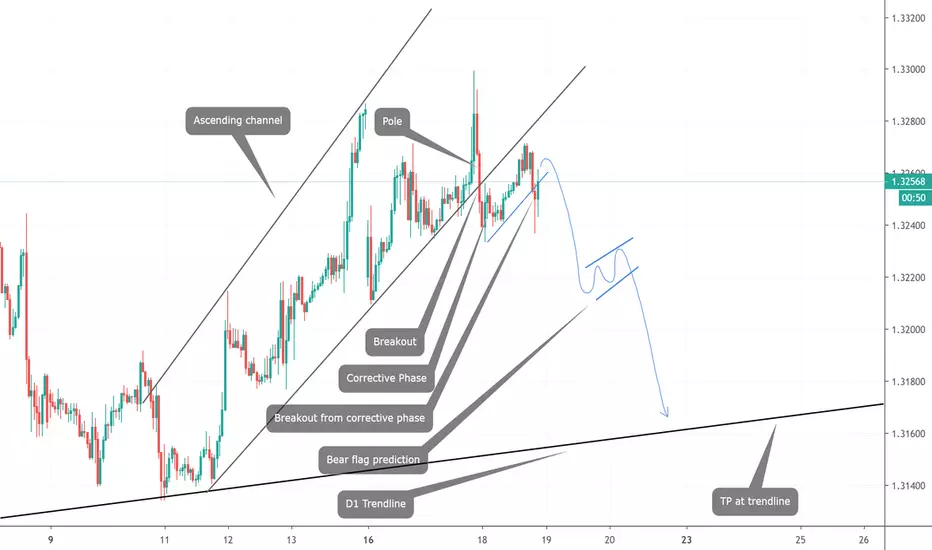
I've analysed USDCAD heading for a downtrend. It has broken off the ascending channel and formed a corrective phase.
From the figure above, it has broken off the corrective phase and could potentially go for a downtrend.
I've set a potential TP point when it touches the trendline on the higher timeframe.
Any comments and opinions please comment below. Thank you :)

Отказ от ответственности
Информация и публикации не предназначены для предоставления и не являются финансовыми, инвестиционными, торговыми или другими видами советов или рекомендаций, предоставленных или одобренных TradingView. Подробнее читайте в Условиях использования.
Отказ от ответственности
Информация и публикации не предназначены для предоставления и не являются финансовыми, инвестиционными, торговыми или другими видами советов или рекомендаций, предоставленных или одобренных TradingView. Подробнее читайте в Условиях использования.