

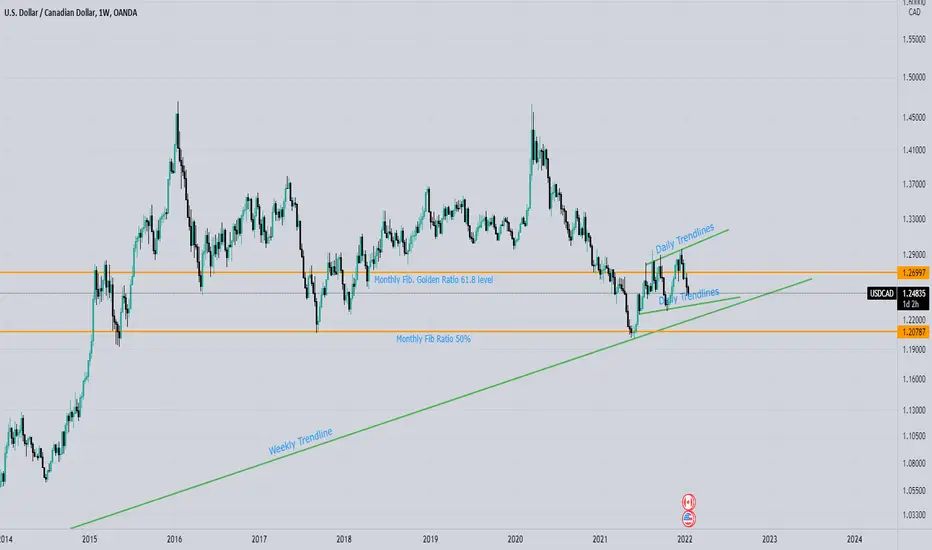
Update:-
As per longer time frame this pair has rejected upper 1D trendline and going to retest its support trendline anytime soon. It can hit 1.238, some weeks ago this pair also bounces from its weekly support which means that it is still strong for longer timeframe. Keep watching candles once the price hit bottom support then you can take long trade as per your risk management and hold till it hits 50% ratio, 61.8% golden ratio or upper resistance level of trendline.
As per longer time frame this pair has rejected upper 1D trendline and going to retest its support trendline anytime soon. It can hit 1.238, some weeks ago this pair also bounces from its weekly support which means that it is still strong for longer timeframe. Keep watching candles once the price hit bottom support then you can take long trade as per your risk management and hold till it hits 50% ratio, 61.8% golden ratio or upper resistance level of trendline.

Отказ от ответственности
Информация и публикации не предназначены для предоставления и не являются финансовыми, инвестиционными, торговыми или другими видами советов или рекомендаций, предоставленных или одобренных TradingView. Подробнее читайте в Условиях использования.
Отказ от ответственности
Информация и публикации не предназначены для предоставления и не являются финансовыми, инвестиционными, торговыми или другими видами советов или рекомендаций, предоставленных или одобренных TradingView. Подробнее читайте в Условиях использования.