Hi everyone!
In the past few weeks we have already traded
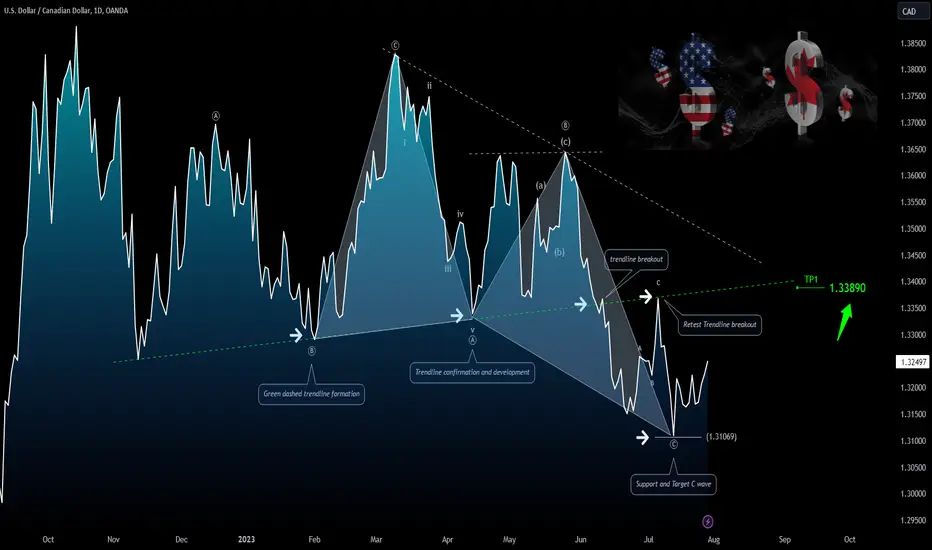
 USDCAD pair on the first trendline re-test, but at the same time this technical element could still be useful to us. The big picture on daily chart is harmonic structure followed by corrective structure with ABC Pattern formation.
✔ At the moment, we remain below an important resistance (not shown on chart), but if there is a bullish breakout during the first hours of trading, another bullish consolidation should appear, pushing the price to retest the trendline around the 1.3389 area.
✔ From a technical point of view and following the pair on intraday chart, it could be interesting to take a long position on pullback or corrective structure that will appear.
During the next hours/sessions, we will publish new updates, even on minor time frame in the section below, or visit our Blog for a more detailed technical analysis. Trade with care.
Analysis by
Anonymous Banker Team
Like | Share | Comment
In the past few weeks we have already traded
USDCAD pair on the first trendline re-test, but at the same time this technical element could still be useful to us. The big picture on daily chart is harmonic structure followed by corrective structure with ABC Pattern formation.✔ At the moment, we remain below an important resistance (not shown on chart), but if there is a bullish breakout during the first hours of trading, another bullish consolidation should appear, pushing the price to retest the trendline around the 1.3389 area.
✔ From a technical point of view and following the pair on intraday chart, it could be interesting to take a long position on pullback or corrective structure that will appear.
During the next hours/sessions, we will publish new updates, even on minor time frame in the section below, or visit our Blog for a more detailed technical analysis. Trade with care.
Analysis by
Anonymous Banker Team
Like | Share | Comment
Заметка
Заметка
📊 Bullish above the support area:Заметка
📈 Daily and Intraday resistance:Заметка
🔔 Intraday resistance:Заметка
🔔 Daily resistance:Заметка
...pullback in short term?Сделка закрыта: достигнута тейк-профит цена
✅ Daily Chart:Заметка
Заметка
💡 New Idea | Updates Daily Chart Analysis: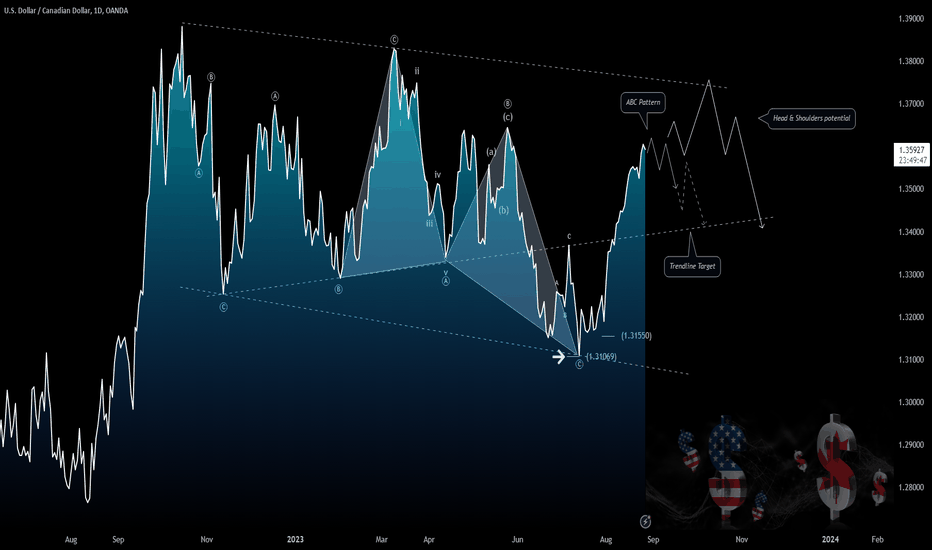
Заметка
💡 Trend is still bullish.
Отказ от ответственности
Информация и публикации не предназначены для предоставления и не являются финансовыми, инвестиционными, торговыми или другими видами советов или рекомендаций, предоставленных или одобренных TradingView. Подробнее читайте в Условиях использования.
Отказ от ответственности
Информация и публикации не предназначены для предоставления и не являются финансовыми, инвестиционными, торговыми или другими видами советов или рекомендаций, предоставленных или одобренных TradingView. Подробнее читайте в Условиях использования.