

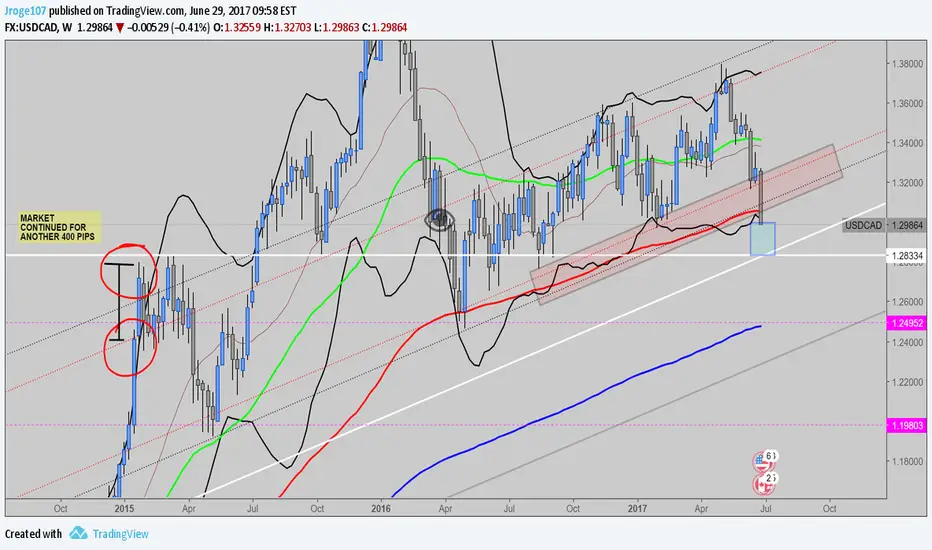
If usdcad weekly candle closes below bollinger bands, i am looking at price to continue down around the 1.275-1.283 range. My "alligator" indicator is showing a full open mouth, with potential of more downside. If you look back on the chart, the last few times the candles close outside of the bollinger bands the market usually continues for a minimum of another 100-200 pips.
This small continuation puts us right around the white support/resistance line. Look for a good sign of a reversal at this time, if a pinbar forms i will be looking at opportunities to enter long into UC.
This small continuation puts us right around the white support/resistance line. Look for a good sign of a reversal at this time, if a pinbar forms i will be looking at opportunities to enter long into UC.

Отказ от ответственности
Информация и публикации не предназначены для предоставления и не являются финансовыми, инвестиционными, торговыми или другими видами советов или рекомендаций, предоставленных или одобренных TradingView. Подробнее читайте в Условиях использования.
Отказ от ответственности
Информация и публикации не предназначены для предоставления и не являются финансовыми, инвестиционными, торговыми или другими видами советов или рекомендаций, предоставленных или одобренных TradingView. Подробнее читайте в Условиях использования.