

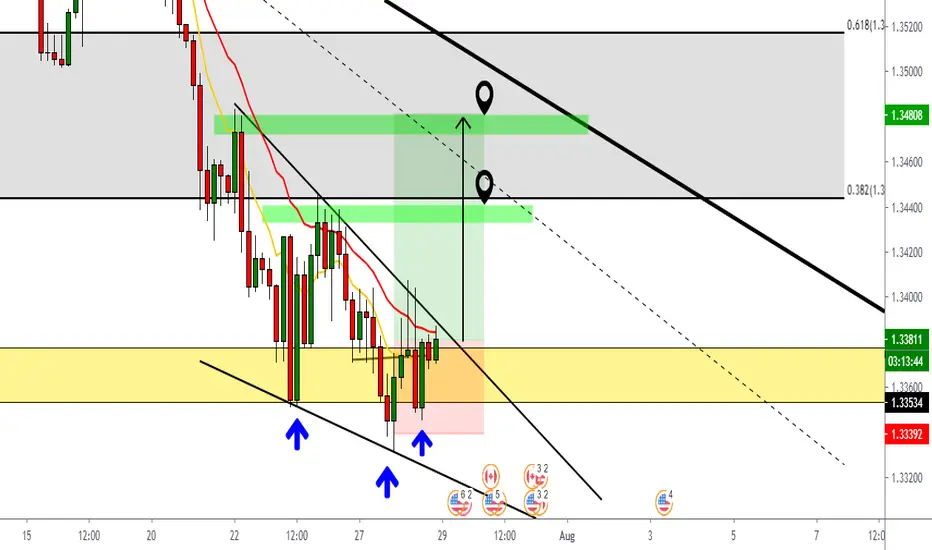
In H4 timeframe we see that USD/CAD is so bearish in the expectative, for now, we found out that USD want to up at least 100 pips or pull back later that in Daily we broke down the Shoulder Head Shoulder. That expectative could reach the price in the 0.382% of Fibonacci using the Daily timeframe, that mean a movement of 100 pips to pick up our earnings. And then, in the 1.3470 approximately we could to put in short position with always the confirmation of price action, it's important to entry in the best zone to buy or sell.

We could see in mid-term the bearish trend following the EMAS that I use to apply in this technical analysis and I believe that the price want' to go up into the EMA 30 in Daily, that is a possibility to earn.
And also, as reference we see a bullish rising wedge!!!
We could see in mid-term the bearish trend following the EMAS that I use to apply in this technical analysis and I believe that the price want' to go up into the EMA 30 in Daily, that is a possibility to earn.
And also, as reference we see a bullish rising wedge!!!

Отказ от ответственности
Информация и публикации не предназначены для предоставления и не являются финансовыми, инвестиционными, торговыми или другими видами советов или рекомендаций, предоставленных или одобренных TradingView. Подробнее читайте в Условиях использования.
Отказ от ответственности
Информация и публикации не предназначены для предоставления и не являются финансовыми, инвестиционными, торговыми или другими видами советов или рекомендаций, предоставленных или одобренных TradingView. Подробнее читайте в Условиях использования.