
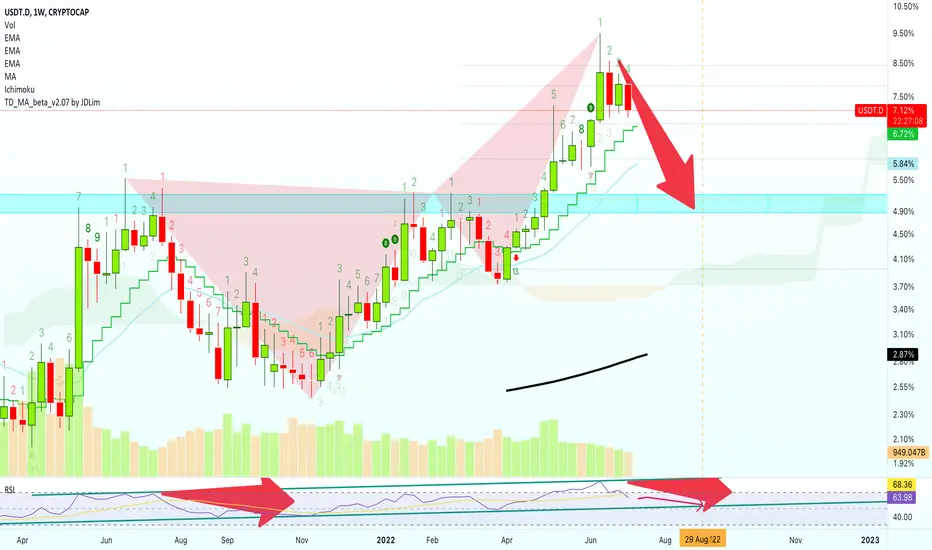
When looking at the weekly chart for USDT.D (Tether Dominance Index), we can notice a full red/bearish candle.
We have a rising channel also breaking bearish:
Together with a bearish harmonic pattern.
The RSI is pointing straight down:
One last signal is MA200, the black line on the chart.
We can see it rising and we know that prices tend to gravitate towards this line.
As MA200 trends up, USDT.D trends down.
Namaste.
We have a rising channel also breaking bearish:
Together with a bearish harmonic pattern.
The RSI is pointing straight down:
One last signal is MA200, the black line on the chart.
We can see it rising and we know that prices tend to gravitate towards this line.
As MA200 trends up, USDT.D trends down.
Namaste.

Trading Cryptocurrencies can be the hardest undertaking ever without the right trade-numbers, without accurate private-access information. Free is free, but the best always requires sweat, an investment. Since 2017 👇
t.me/masteranandatrades/8778
t.me/masteranandatrades/8778
Похожие публикации
Отказ от ответственности
Информация и публикации не предназначены для предоставления и не являются финансовыми, инвестиционными, торговыми или другими видами советов или рекомендаций, предоставленных или одобренных TradingView. Подробнее читайте в Условиях использования.
Trading Cryptocurrencies can be the hardest undertaking ever without the right trade-numbers, without accurate private-access information. Free is free, but the best always requires sweat, an investment. Since 2017 👇
t.me/masteranandatrades/8778
t.me/masteranandatrades/8778
Похожие публикации
Отказ от ответственности
Информация и публикации не предназначены для предоставления и не являются финансовыми, инвестиционными, торговыми или другими видами советов или рекомендаций, предоставленных или одобренных TradingView. Подробнее читайте в Условиях использования.