
USDT DOMINANCE ANALYSIS
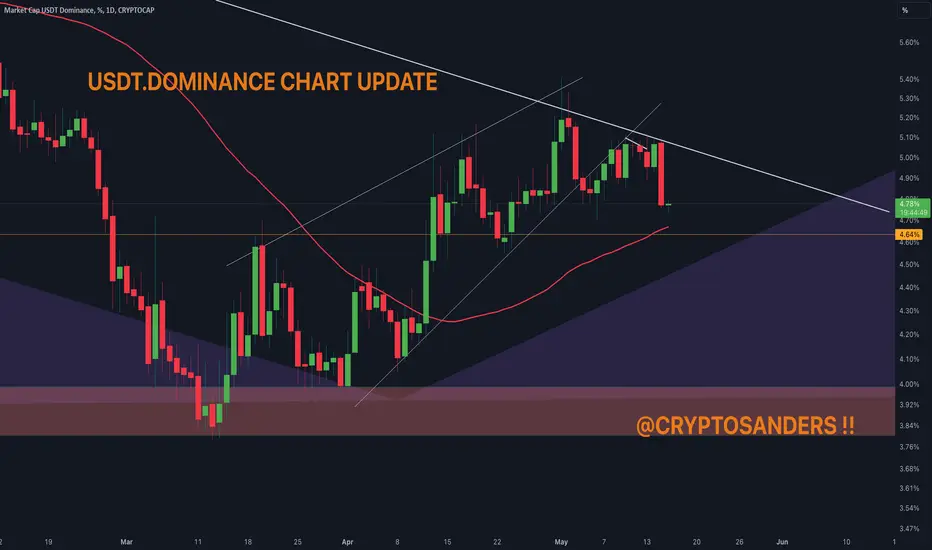
USDT.D is descending following a retest below the rising wedge. It's also breaking through the MA 50, with a candle close below it confirming a bearish sentiment. Notably, a bearish USDTD trend often indicates bullish momentum for the broader crypto market due to their inverse relationship.
I have tried to bring the best possible results in this chart.
If you like it, hit the like button and share your charts in the comments section.
Thank you.
USDT.D is descending following a retest below the rising wedge. It's also breaking through the MA 50, with a candle close below it confirming a bearish sentiment. Notably, a bearish USDTD trend often indicates bullish momentum for the broader crypto market due to their inverse relationship.
I have tried to bring the best possible results in this chart.
If you like it, hit the like button and share your charts in the comments section.
Thank you.

Похожие публикации
Отказ от ответственности
Информация и публикации не предназначены для предоставления и не являются финансовыми, инвестиционными, торговыми или другими видами советов или рекомендаций, предоставленных или одобренных TradingView. Подробнее читайте в Условиях использования.
Похожие публикации
Отказ от ответственности
Информация и публикации не предназначены для предоставления и не являются финансовыми, инвестиционными, торговыми или другими видами советов или рекомендаций, предоставленных или одобренных TradingView. Подробнее читайте в Условиях использования.