
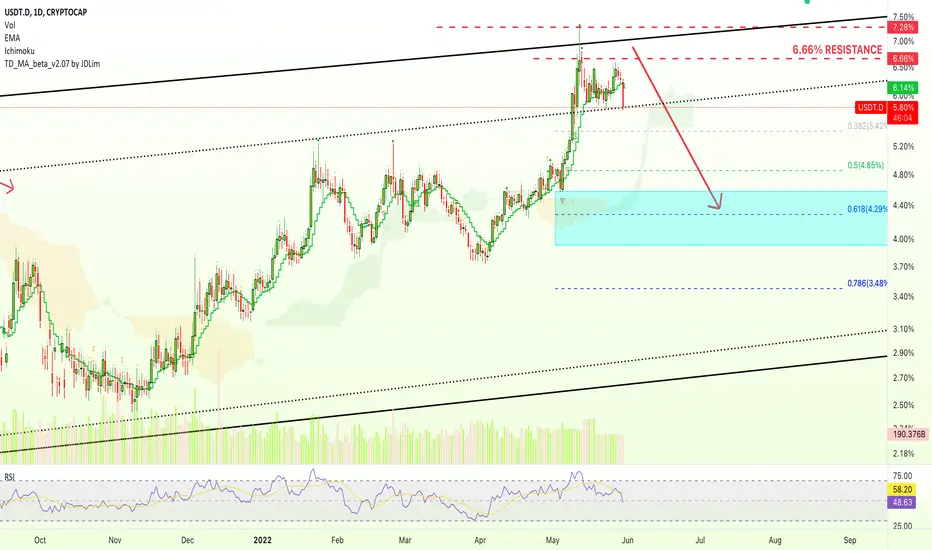
We continue seeing bearish signals on the Tether Dominance Index (USDT.D) chart.
Yesterday we looked at the long-term chart and the RSI (weekly), the signals were clear there.
Looking at it closer today, our view remains the same.
- We can see prices moving below EMA10 on a full bearish candle.
- The RSI is trending down strong.
These signals are pointing lower.
The blue space on the chart is the main target/support.
Namaste.
Yesterday we looked at the long-term chart and the RSI (weekly), the signals were clear there.
Looking at it closer today, our view remains the same.
- We can see prices moving below EMA10 on a full bearish candle.
- The RSI is trending down strong.
These signals are pointing lower.
The blue space on the chart is the main target/support.
Namaste.

Trading Cryptocurrencies can be the hardest undertaking ever without the right trade-numbers, without accurate private-access information. Free is free, but the best always requires sweat, an investment. Since 2017 👇
t.me/masteranandatrades/8778
t.me/masteranandatrades/8778
Похожие публикации
Отказ от ответственности
Информация и публикации не предназначены для предоставления и не являются финансовыми, инвестиционными, торговыми или другими видами советов или рекомендаций, предоставленных или одобренных TradingView. Подробнее читайте в Условиях использования.
Trading Cryptocurrencies can be the hardest undertaking ever without the right trade-numbers, without accurate private-access information. Free is free, but the best always requires sweat, an investment. Since 2017 👇
t.me/masteranandatrades/8778
t.me/masteranandatrades/8778
Похожие публикации
Отказ от ответственности
Информация и публикации не предназначены для предоставления и не являются финансовыми, инвестиционными, торговыми или другими видами советов или рекомендаций, предоставленных или одобренных TradingView. Подробнее читайте в Условиях использования.