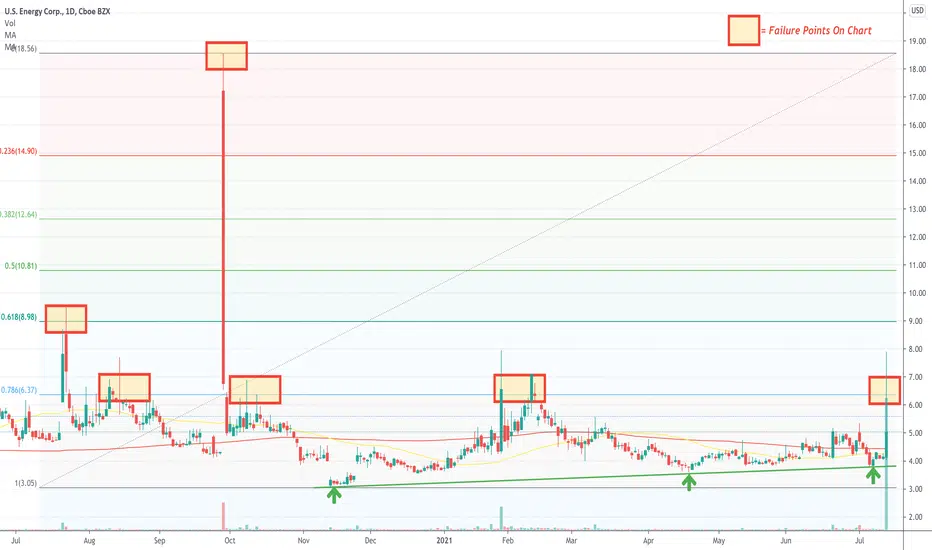
 USEG is a relatively flat stock for the most part. It's had its share of breakouts here and there but seems to call anything under the 786 fib home. Coincidentally, over the last year, this same 786 fib level has remained a pain point on the chart where USEG might break above it for a moment but fails to hold any significant level of support after doing so. That's what happened on 7/14 once again. BUT something that can also be seen is the very slight uptrend since November. When I say "uptrend, I'm referring to higher lows versus that green trendline. Will this get retested after today (7/14) or is there hope for another rally this week?
Similar short term pops have happened since last September most notably. That is when the stock popped to $18.57 then dropped like a 3 ton weight.

Отказ от ответственности
Информация и публикации не предназначены для предоставления и не являются финансовыми, инвестиционными, торговыми или другими видами советов или рекомендаций, предоставленных или одобренных TradingView. Подробнее читайте в Условиях использования.
Отказ от ответственности
Информация и публикации не предназначены для предоставления и не являются финансовыми, инвестиционными, торговыми или другими видами советов или рекомендаций, предоставленных или одобренных TradingView. Подробнее читайте в Условиях использования.