
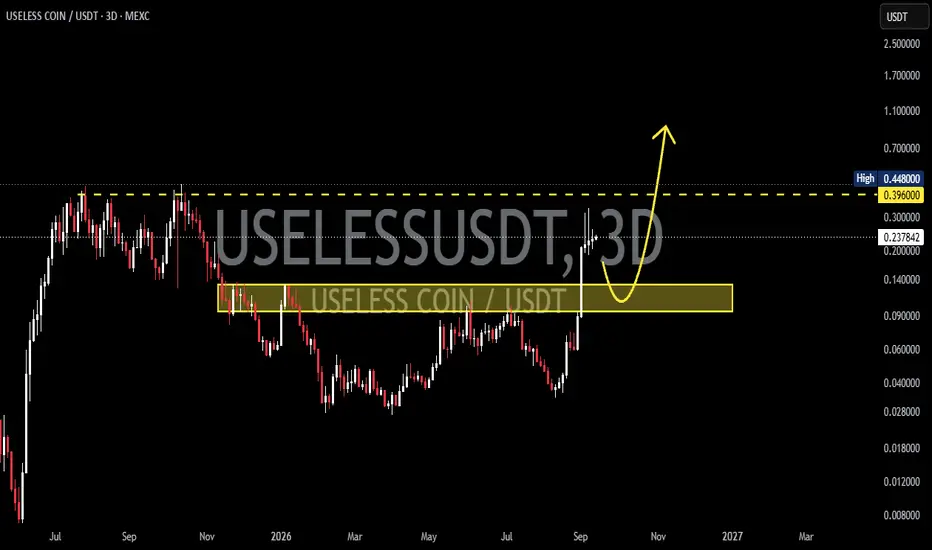
The  USELESS chart shows an interesting structural shift after a prolonged consolidation/accumulation phase from late 2025 through mid-2026. Price subsequently moved higher and broke out of the previous resistance/structure, making the yellow zone an important area for testing the validity of that breakout.
🟨 Key Support / Retest Zone: $0.099 – $0.132
🔴 Major Resistance: $0.396
🔵 Previous High: $0.448
📍 Current Price: around $0.2387
---
🧩 Pattern & Market Structure
🔄 Broad Accumulation / Re-Accumulation Structure
Price previously experienced a prolonged decline from the $0.40+ area and then formed a base/accumulation phase, with multiple rejections around the lower area.
Over time, the structure began to show:
📉 Selling pressure gradually weakened
➡️ Price formed a more stable base
📈 Higher Lows began to develop
🚀 Price then broke through the $0.099–$0.132 area
🔄 The breakout area now has the potential to turn into support
This makes the current structure interesting as a breakout → retest → continuation setup.
---
🟨 SUPPORT RETEST — $0.099–$0.132
The yellow zone is the most important part of this setup.
After the breakout, price has already moved significantly above this zone. Technically, a retest of the breakout/support area can be a normal process before the next bullish continuation.
🎯 Primary Expectation:
Price retraces toward $0.132–$0.099, then searches for rejection/buyer reaction before moving higher again.
💡 As long as price is able to hold this zone as support, the previous breakout still has the potential to develop into a continuation move.
---
🟢 BULLISH SCENARIO — Retest & Continuation
🚀 Bullish Case
IfUSELESS corrects into the $0.099–$0.132 zone and then forms a bullish rejection with buyers regaining control:
🟨 $0.099–$0.132 → Support Retest
📈 Buyers defend the zone
🔄 Price forms a Higher Low
🚀 Bullish momentum increases again
🎯 Price could potentially test $0.396
🔥 If $0.396 is successfully broken → potential retest of $0.448
🚀 A breakout above $0.448 could open the way toward higher psychological price areas.
In this type of structure, a successful retest can actually confirm that the previous resistance has turned into support.
---
🔴 BEARISH SCENARIO — Failed Breakout
⚠️ The bearish scenario needs attention if the retest fails to produce a bullish reaction.
If price enters the $0.099–$0.132 zone and breaks down:
📉 Support begins to lose strength
🔻 Price fails to reclaim $0.132
⚠️ Selling pressure increases
❌ A strong breakdown below $0.099 would be an important invalidation of the bullish setup.
If $0.099 definitively loses support on the 3D timeframe, the previous breakout could become a failed breakout, and price may return to search for lower support/liquidity.
---
🎯 KEY LEVELS TO WATCH
🟨 $0.099 – $0.132 → Major Retest / Support Zone
📈 $0.2387 → Current Price Area
🔴 $0.396 → Major Resistance
🔵 $0.448 → Previous High / Breakout Level
🚀 $0.70–$1.00+ → Higher-price expansion area if the major resistance breakout gains strong momentum
---
🧠 MARKET OUTLOOK
Overall, the 3D structure ofUSELESS remains interesting as long as price can hold $0.099–$0.132.
📌 The most interesting setup is not chasing price after the rally, but waiting to see whether price retests the yellow block and how buyers react within that zone.
🟢 Bullish: Retest $0.099–$0.132 → Rejection → Continuation → $0.396 → $0.448 → Potential Expansion Higher.
🔴 Bearish: Breakdown below $0.099 → Bullish breakout structure weakens/invalidates → Potential Search for Lower Support.
🔥 Key Idea:
“Breakout is only the first step. The real confirmation comes from how price reacts when it retests the breakout zone.”
#USELESS #USELESSCOIN #Crypto
USELESS chart shows an interesting structural shift after a prolonged consolidation/accumulation phase from late 2025 through mid-2026. Price subsequently moved higher and broke out of the previous resistance/structure, making the yellow zone an important area for testing the validity of that breakout.🟨 Key Support / Retest Zone: $0.099 – $0.132
🔴 Major Resistance: $0.396
🔵 Previous High: $0.448
📍 Current Price: around $0.2387
---
🧩 Pattern & Market Structure
🔄 Broad Accumulation / Re-Accumulation Structure
Price previously experienced a prolonged decline from the $0.40+ area and then formed a base/accumulation phase, with multiple rejections around the lower area.
Over time, the structure began to show:
📉 Selling pressure gradually weakened
➡️ Price formed a more stable base
📈 Higher Lows began to develop
🚀 Price then broke through the $0.099–$0.132 area
🔄 The breakout area now has the potential to turn into support
This makes the current structure interesting as a breakout → retest → continuation setup.
---
🟨 SUPPORT RETEST — $0.099–$0.132
The yellow zone is the most important part of this setup.
After the breakout, price has already moved significantly above this zone. Technically, a retest of the breakout/support area can be a normal process before the next bullish continuation.
🎯 Primary Expectation:
Price retraces toward $0.132–$0.099, then searches for rejection/buyer reaction before moving higher again.
💡 As long as price is able to hold this zone as support, the previous breakout still has the potential to develop into a continuation move.
---
🟢 BULLISH SCENARIO — Retest & Continuation
🚀 Bullish Case
If
USELESS corrects into the $0.099–$0.132 zone and then forms a bullish rejection with buyers regaining control:🟨 $0.099–$0.132 → Support Retest
📈 Buyers defend the zone
🔄 Price forms a Higher Low
🚀 Bullish momentum increases again
🎯 Price could potentially test $0.396
🔥 If $0.396 is successfully broken → potential retest of $0.448
🚀 A breakout above $0.448 could open the way toward higher psychological price areas.
In this type of structure, a successful retest can actually confirm that the previous resistance has turned into support.
---
🔴 BEARISH SCENARIO — Failed Breakout
⚠️ The bearish scenario needs attention if the retest fails to produce a bullish reaction.
If price enters the $0.099–$0.132 zone and breaks down:
📉 Support begins to lose strength
🔻 Price fails to reclaim $0.132
⚠️ Selling pressure increases
❌ A strong breakdown below $0.099 would be an important invalidation of the bullish setup.
If $0.099 definitively loses support on the 3D timeframe, the previous breakout could become a failed breakout, and price may return to search for lower support/liquidity.
---
🎯 KEY LEVELS TO WATCH
🟨 $0.099 – $0.132 → Major Retest / Support Zone
📈 $0.2387 → Current Price Area
🔴 $0.396 → Major Resistance
🔵 $0.448 → Previous High / Breakout Level
🚀 $0.70–$1.00+ → Higher-price expansion area if the major resistance breakout gains strong momentum
---
🧠 MARKET OUTLOOK
Overall, the 3D structure of
USELESS remains interesting as long as price can hold $0.099–$0.132.📌 The most interesting setup is not chasing price after the rally, but waiting to see whether price retests the yellow block and how buyers react within that zone.
🟢 Bullish: Retest $0.099–$0.132 → Rejection → Continuation → $0.396 → $0.448 → Potential Expansion Higher.
🔴 Bearish: Breakdown below $0.099 → Bullish breakout structure weakens/invalidates → Potential Search for Lower Support.
🔥 Key Idea:
“Breakout is only the first step. The real confirmation comes from how price reacts when it retests the breakout zone.”
#USELESS #USELESSCOIN #Crypto

✅ Get Free Signals! Join Our Telegram Channel Here: t.me/TheCryptoNuclear
✅ Twitter: twitter.com/crypto_nuclear
✅ Join Bybit : partner.bybit.com/b/nuclearvip
✅ Benefits : Lifetime Trading Fee Discount -50%
✅ Twitter: twitter.com/crypto_nuclear
✅ Join Bybit : partner.bybit.com/b/nuclearvip
✅ Benefits : Lifetime Trading Fee Discount -50%
Отказ от ответственности
Информация и публикации не предназначены для предоставления и не являются финансовыми, инвестиционными, торговыми или другими видами советов или рекомендаций, предоставленных или одобренных TradingView. Подробнее читайте в Условиях использования.
✅ Get Free Signals! Join Our Telegram Channel Here: t.me/TheCryptoNuclear
✅ Twitter: twitter.com/crypto_nuclear
✅ Join Bybit : partner.bybit.com/b/nuclearvip
✅ Benefits : Lifetime Trading Fee Discount -50%
✅ Twitter: twitter.com/crypto_nuclear
✅ Join Bybit : partner.bybit.com/b/nuclearvip
✅ Benefits : Lifetime Trading Fee Discount -50%
Отказ от ответственности
Информация и публикации не предназначены для предоставления и не являются финансовыми, инвестиционными, торговыми или другими видами советов или рекомендаций, предоставленных или одобренных TradingView. Подробнее читайте в Условиях использования.