
US CPI
US Headline and Core CPI for October both came in lower than expected (decrease).
US Headline CPI:
US Core CPI:
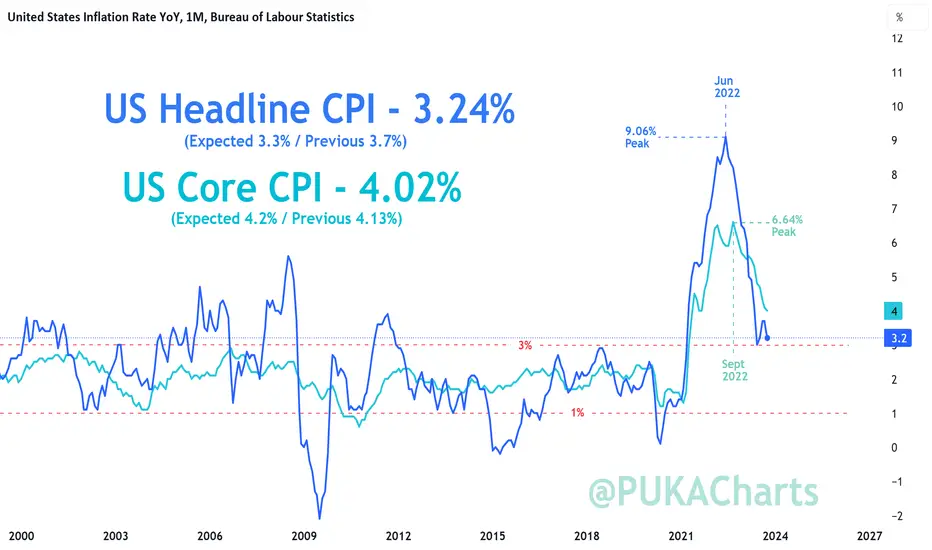
The chart below illustrates the direction of the current YoY down trend for both Headline and Core CPI however we are still not at the historical moderate levels of inflation desired. You can see these moderate levels of inflation between 1 – 3% from 2002 – 2020 below.
Nice to see the Core CPI come down, almost down, into the moderate historical averages
PUKA
US Headline and Core CPI for October both came in lower than expected (decrease).
US Headline CPI:
- YoY – Actual 3.24% / Exp. 3.3% / Prev. 3.7% (Green on cha
US Core CPI:
- YoY – Actual 4.02% / Exp. 4.2% / Prev. 4.13% (Blue on chart)
The chart below illustrates the direction of the current YoY down trend for both Headline and Core CPI however we are still not at the historical moderate levels of inflation desired. You can see these moderate levels of inflation between 1 – 3% from 2002 – 2020 below.
Nice to see the Core CPI come down, almost down, into the moderate historical averages
PUKA

Похожие публикации
Отказ от ответственности
Информация и публикации не предназначены для предоставления и не являются финансовыми, инвестиционными, торговыми или другими видами советов или рекомендаций, предоставленных или одобренных TradingView. Подробнее читайте в Условиях использования.
Похожие публикации
Отказ от ответственности
Информация и публикации не предназначены для предоставления и не являются финансовыми, инвестиционными, торговыми или другими видами советов или рекомендаций, предоставленных или одобренных TradingView. Подробнее читайте в Условиях использования.