US Inflation Rate YoY Comparison -  USIRYY
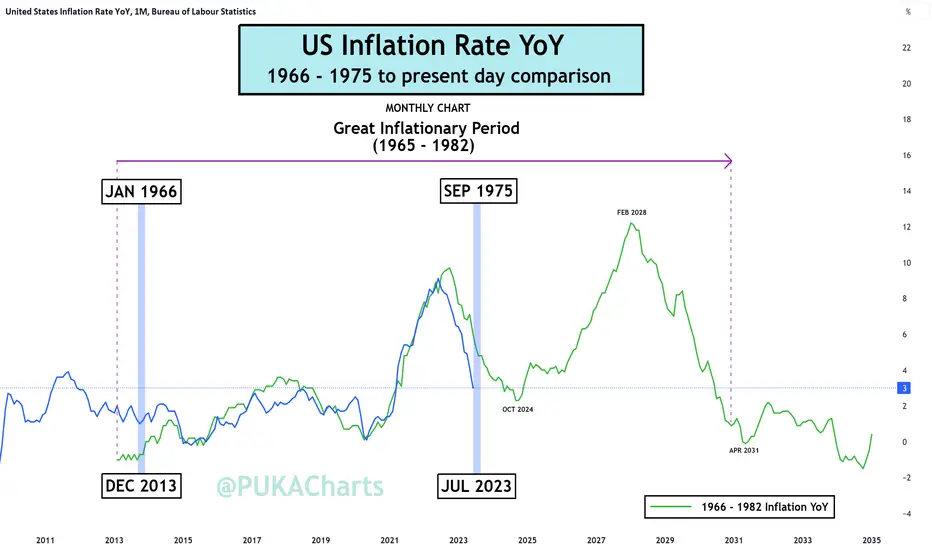
Stark similarities to the beginning of the Great Inflationary Period (GIP) which ranged from 1965 - 1982.
The GIP fractal is not a prediction, it only offers us perspective and context. As an example, US Inflation YoY could potentially bounce around between 3 - 4% for another 32 months as it did between 1975 - 1978 before making any major move. This is a scenario I had not considered, an almost 3 year sideways boring consolidation.
We will continue to track this chart to see how it compares moving forward into the future.
PUKA
USIRYYStark similarities to the beginning of the Great Inflationary Period (GIP) which ranged from 1965 - 1982.
The GIP fractal is not a prediction, it only offers us perspective and context. As an example, US Inflation YoY could potentially bounce around between 3 - 4% for another 32 months as it did between 1975 - 1978 before making any major move. This is a scenario I had not considered, an almost 3 year sideways boring consolidation.
We will continue to track this chart to see how it compares moving forward into the future.
PUKA
Заметка
Just like my S&P500 comparison chart to the 1966 - 1973 period, this inflation rate comparison over the same period (albeit out to 1982) is demonstrating some very similar moves. Time will tell if the FED are in control here and if a repeat of the 70's will occur or not.

Похожие публикации
Отказ от ответственности
Информация и публикации не предназначены для предоставления и не являются финансовыми, инвестиционными, торговыми или другими видами советов или рекомендаций, предоставленных или одобренных TradingView. Подробнее читайте в Условиях использования.
Похожие публикации
Отказ от ответственности
Информация и публикации не предназначены для предоставления и не являются финансовыми, инвестиционными, торговыми или другими видами советов или рекомендаций, предоставленных или одобренных TradingView. Подробнее читайте в Условиях использования.