
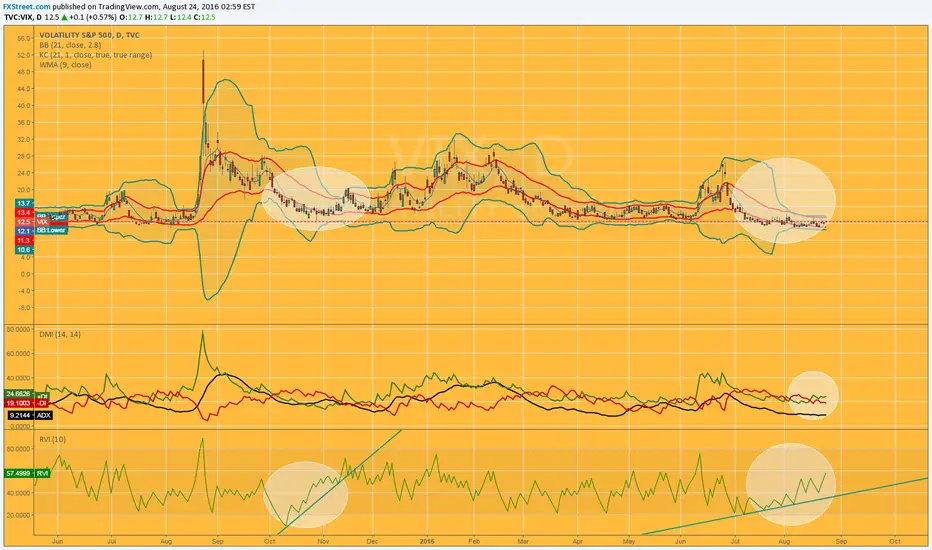
The practice already tells us that the Vix not last long at these levels, now looking for when it will move.
Relative Volatility Index: shows a pattern that previously led to the movement.
Directional Movement: DI + moves easily over 20 (24.66).
Bollinger / Kelner: The narrowing of the Bollinger Bands, penetrating moments in the Kellner brings us closer to a pattern with a wildly expansive below.
fxstreet.com/rates-charts
Relative Volatility Index: shows a pattern that previously led to the movement.
Directional Movement: DI + moves easily over 20 (24.66).
Bollinger / Kelner: The narrowing of the Bollinger Bands, penetrating moments in the Kellner brings us closer to a pattern with a wildly expansive below.
fxstreet.com/rates-charts

Отказ от ответственности
Информация и публикации не предназначены для предоставления и не являются финансовыми, инвестиционными, торговыми или другими видами советов или рекомендаций, предоставленных или одобренных TradingView. Подробнее читайте в Условиях использования.
Отказ от ответственности
Информация и публикации не предназначены для предоставления и не являются финансовыми, инвестиционными, торговыми или другими видами советов или рекомендаций, предоставленных или одобренных TradingView. Подробнее читайте в Условиях использования.