
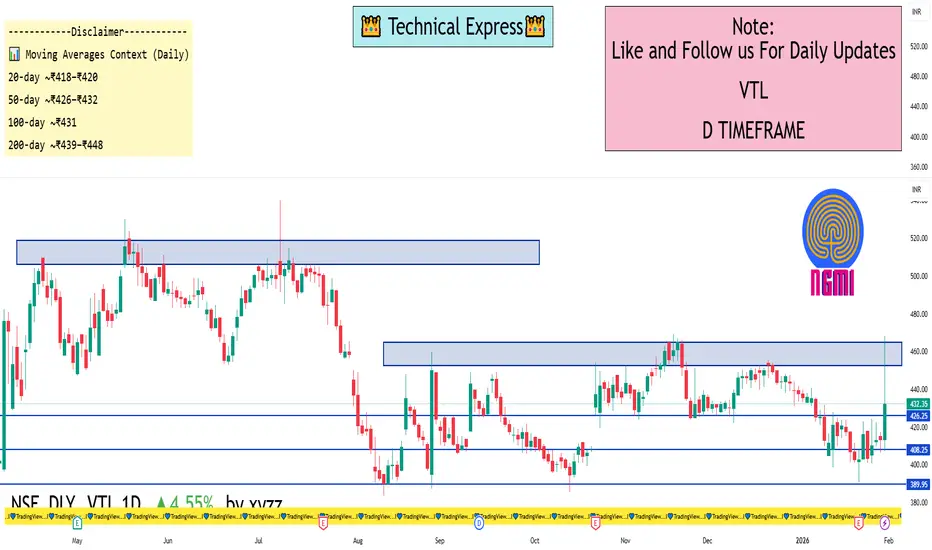
📍 Latest Price Context (Daily Close)
Approx. share price: ~₹432 – ₹433 on NSE (close of last session).
Today’s range (recent session): High ~₹468, Low ~₹407.45.
52-week range: Low ~₹361.10, High ~₹539.90.
📊 Key Daily Levels (1-Day Time Frame)
🔑 Pivot & Intraday Levels
(Based on pivot point calculations for the daily session)
Central Pivot (Daily): ~₹412.33 – baseline pivot for directional bias.
📈 Resistance Levels
R1 ~₹418 – ₹423 – first near-term resistance zone.
R2 ~₹423 – ₹429 – next resistance above pivot.
R3 ~₹429 – ₹446 (or higher intraday) – notable upper resistance zone if price strengthens.
👉 Bullish scenario: Daily close above ~₹429-₹435 could trigger further upside momentum toward higher resistance zones (based on recent highs).
📉 Support Levels
S1 ~₹407 – ₹410 – short-term support near today’s low zone.
S2 ~₹401 – ₹405 – secondary support if price declines below S1.
S3 ~₹396 – ₹399 – deeper support on a pullback.
👉 Bearish scenario: A daily close below ~₹401-₹396 may open further decline toward lower support clusters.
📌 Simple Interpretation (Daily TF)
📍 Above Pivot (~₹412): Slightly bullish / range control.
📍 Holding Support (~₹407 – ₹401): Helps limit downside.
📍 Break above ~₹429: Potential for continuation to next resistance area.
📍 Break below ~₹396: Bearish momentum intensifies.
⚠️ Notes
Levels are based on standard pivot and support/resistance derivations — actual intraday price action may vary with market volatility.
For live charts and real-time plotting, it’s best to check TradingView, your broker’s charting tool, or other live market platforms.
Approx. share price: ~₹432 – ₹433 on NSE (close of last session).
Today’s range (recent session): High ~₹468, Low ~₹407.45.
52-week range: Low ~₹361.10, High ~₹539.90.
📊 Key Daily Levels (1-Day Time Frame)
🔑 Pivot & Intraday Levels
(Based on pivot point calculations for the daily session)
Central Pivot (Daily): ~₹412.33 – baseline pivot for directional bias.
📈 Resistance Levels
R1 ~₹418 – ₹423 – first near-term resistance zone.
R2 ~₹423 – ₹429 – next resistance above pivot.
R3 ~₹429 – ₹446 (or higher intraday) – notable upper resistance zone if price strengthens.
👉 Bullish scenario: Daily close above ~₹429-₹435 could trigger further upside momentum toward higher resistance zones (based on recent highs).
📉 Support Levels
S1 ~₹407 – ₹410 – short-term support near today’s low zone.
S2 ~₹401 – ₹405 – secondary support if price declines below S1.
S3 ~₹396 – ₹399 – deeper support on a pullback.
👉 Bearish scenario: A daily close below ~₹401-₹396 may open further decline toward lower support clusters.
📌 Simple Interpretation (Daily TF)
📍 Above Pivot (~₹412): Slightly bullish / range control.
📍 Holding Support (~₹407 – ₹401): Helps limit downside.
📍 Break above ~₹429: Potential for continuation to next resistance area.
📍 Break below ~₹396: Bearish momentum intensifies.
⚠️ Notes
Levels are based on standard pivot and support/resistance derivations — actual intraday price action may vary with market volatility.
For live charts and real-time plotting, it’s best to check TradingView, your broker’s charting tool, or other live market platforms.

Похожие публикации
Отказ от ответственности
Информация и публикации не предназначены для предоставления и не являются финансовыми, инвестиционными, торговыми или другими видами советов или рекомендаций, предоставленных или одобренных TradingView. Подробнее читайте в Условиях использования.
Похожие публикации
Отказ от ответственности
Информация и публикации не предназначены для предоставления и не являются финансовыми, инвестиционными, торговыми или другими видами советов или рекомендаций, предоставленных или одобренных TradingView. Подробнее читайте в Условиях использования.