
The VIX measures volatility and option pricing for the S&P 500.
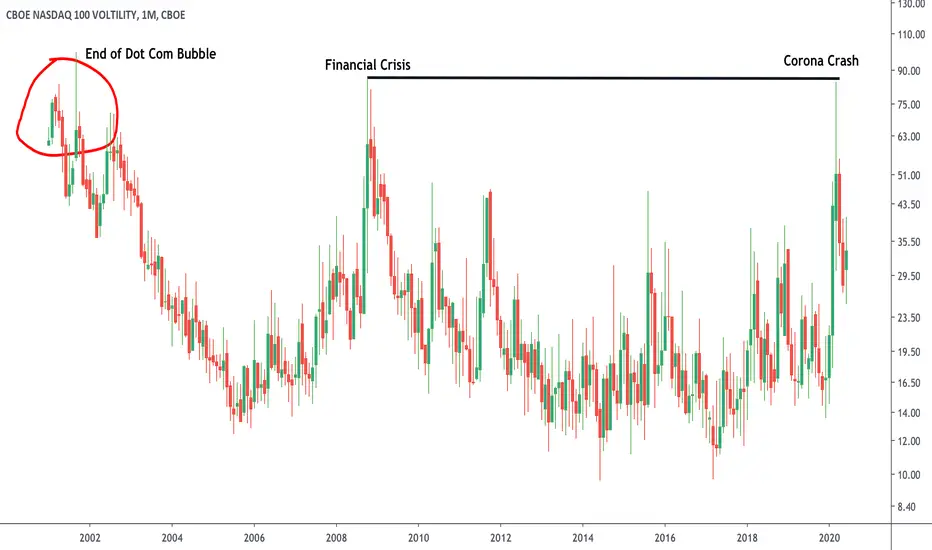
The VXN measures volatility and option pricing for the Nasdaq-100. That's what this chart shows.
Volatility has been subdued since the Coronavirus first broke out. And now, it's time to watch how long that lasts. It may just keep dropping from here. Volatility dropped at the end of the Dot Com Bubble and Financial Crisis for several years. It also peaked at the exact same level.
So are we out of this already? Let's just say I have this chart bookmarked.
The VXN measures volatility and option pricing for the Nasdaq-100. That's what this chart shows.
Volatility has been subdued since the Coronavirus first broke out. And now, it's time to watch how long that lasts. It may just keep dropping from here. Volatility dropped at the end of the Dot Com Bubble and Financial Crisis for several years. It also peaked at the exact same level.
So are we out of this already? Let's just say I have this chart bookmarked.

Отказ от ответственности
Информация и публикации не предназначены для предоставления и не являются финансовыми, инвестиционными, торговыми или другими видами советов или рекомендаций, предоставленных или одобренных TradingView. Подробнее читайте в Условиях использования.
Отказ от ответственности
Информация и публикации не предназначены для предоставления и не являются финансовыми, инвестиционными, торговыми или другими видами советов или рекомендаций, предоставленных или одобренных TradingView. Подробнее читайте в Условиях использования.