Длинная
WAVES Bullish Flag (Potentially 40% UP)
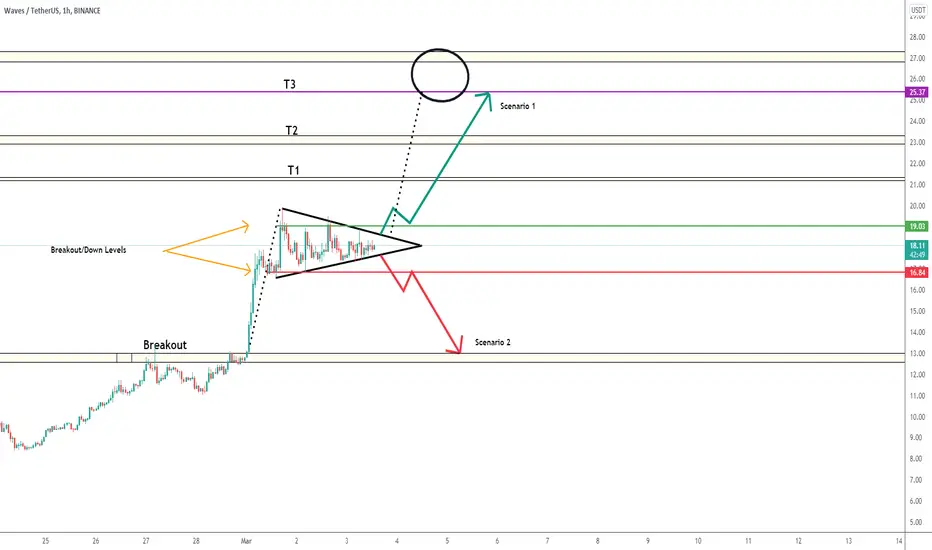
Waves broke the resistance at roughly 13 dollars, and now its forming a bull flag.
Scenario 1 - If WAVES managed to break above the resistance line as highlighted, then and on the balance of probabilities, it is expected that wave will reach the targets illustrated on the chart
Scenario 2 - If waves failed to maintain the support and broke below, I don't see any support to hold it all the way back to the breakout point at roughly 13 dollars
Scenario 1 - If WAVES managed to break above the resistance line as highlighted, then and on the balance of probabilities, it is expected that wave will reach the targets illustrated on the chart
Scenario 2 - If waves failed to maintain the support and broke below, I don't see any support to hold it all the way back to the breakout point at roughly 13 dollars
Заметка
WAVES broke above the breakout level on the hourlyЗаметка
Scenario 1 achieved the first target but currently it has been invalidated Will keep you updated on the Scenario 2 as it is currently reaching the breakdown level
Заметка
Although the move didn't play exactly as described, as we all know TA is subjective, hence, looking back at the chart, I believe that WAVES was running defined between the two breakout ranges (rather than triangle formation)at the time of posting 2 targets achieved
Сделка закрыта: достигнута тейк-профит цена
All Targets achieved
Отказ от ответственности
Информация и публикации не предназначены для предоставления и не являются финансовыми, инвестиционными, торговыми или другими видами советов или рекомендаций, предоставленных или одобренных TradingView. Подробнее читайте в Условиях использования.
Отказ от ответственности
Информация и публикации не предназначены для предоставления и не являются финансовыми, инвестиционными, торговыми или другими видами советов или рекомендаций, предоставленных или одобренных TradingView. Подробнее читайте в Условиях использования.