
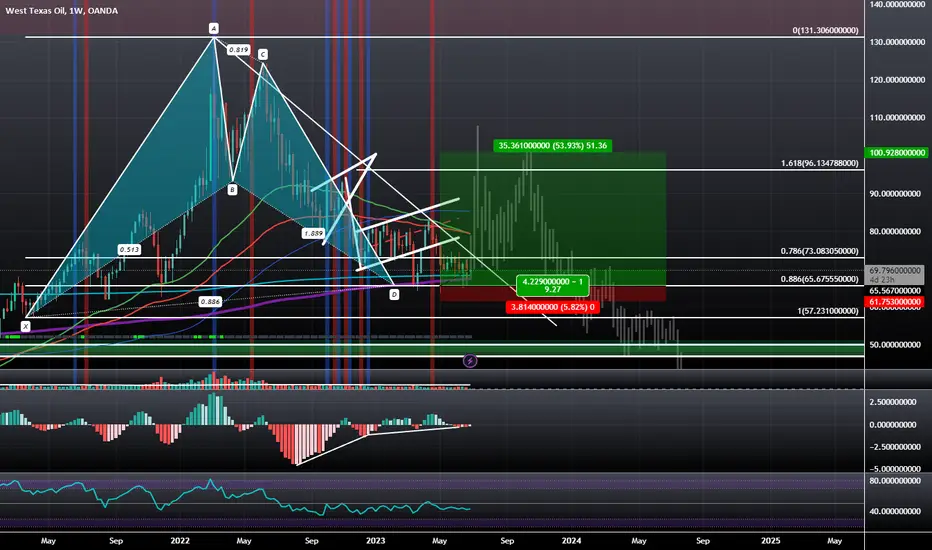
We have a Triple MACD Bullish Divergence at the PCZ of a Bullish Bat that happens to align with the 200-Week SMA and the 800-Week EMA. I have generally been bearish on this chart since the highs back in 2022: tradingview.com/chart/WTICOUSD/YsLzMLja-WTICO-Reversing-at-PCZ-of-Bearish-Shark-on-the-Monthly/, but the persistence it's shown at this Harmonic and Technical level of confluence makes it hard to ignore the potential for at least a 50% move up back to the level of $100.
The 1.618 is at the level of $96.13 but usually if price gets that close to $100, the asset ends up hitting $100, so my target will be $100.
I do think that after it hits the level of $100, it will likely come back down and continue the bearish trend all the way down to even $10, but in the meantime, it looks like there is a decent chance of a short-term rally, which in this case happens to be about a 50% move up from the current level.
The 1.618 is at the level of $96.13 but usually if price gets that close to $100, the asset ends up hitting $100, so my target will be $100.
I do think that after it hits the level of $100, it will likely come back down and continue the bearish trend all the way down to even $10, but in the meantime, it looks like there is a decent chance of a short-term rally, which in this case happens to be about a 50% move up from the current level.
Сделка закрыта: достигнута тейк-профит цена
Closing this trade early at a profit due to the newly formed Bearish pattern seen here: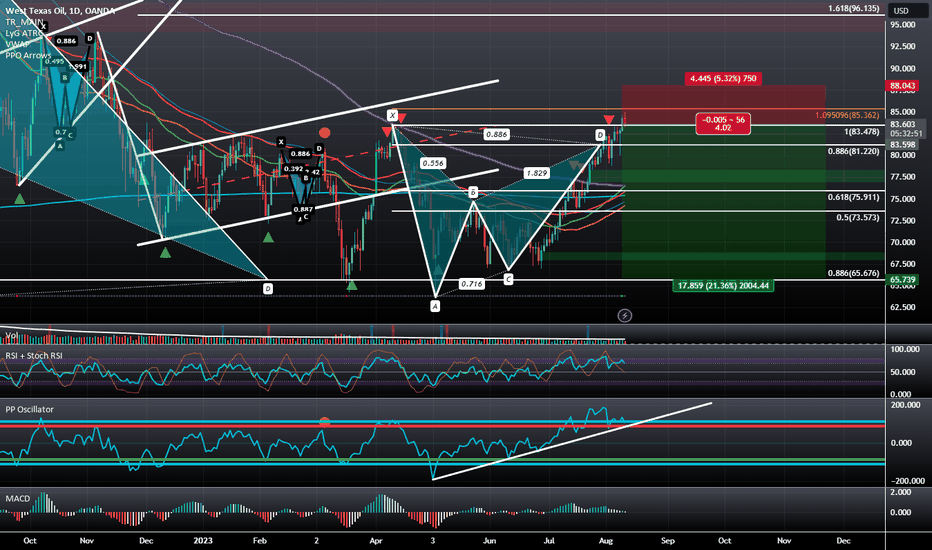

Похожие публикации
Отказ от ответственности
Информация и публикации не предназначены для предоставления и не являются финансовыми, инвестиционными, торговыми или другими видами советов или рекомендаций, предоставленных или одобренных TradingView. Подробнее читайте в Условиях использования.
Похожие публикации
Отказ от ответственности
Информация и публикации не предназначены для предоставления и не являются финансовыми, инвестиционными, торговыми или другими видами советов или рекомендаций, предоставленных или одобренных TradingView. Подробнее читайте в Условиях использования.