
1. Price Action Context
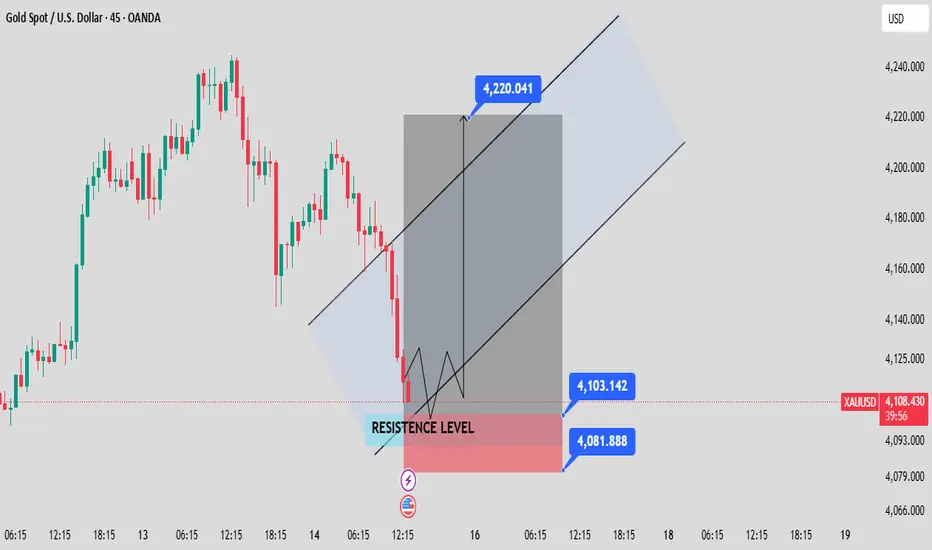
Gold (XAUUSD) has been in a short-term downtrend, shown by a sequence of lower highs and lower lows.
Price is currently trading around 4113 after a sharp drop.
2. Key Zone: RESISTANCE Turned SUPPORT
The highlighted red zone around 4081 – 4103 is marked as a major support / demand zone.
This appears to be a level where buyers are expected to step in.
The squiggly black arrows indicate a possible liquidity grab or fake breakout before the true move begins.
3. Projected Bullish Recovery
The gray vertical projection box and upward channel lines suggest the author expects:
A bounce from the 4081–4103 support
A move up through the channel
A potential target around 4220, which aligns with the upper boundary of the projected ascending channel.
4. Trend Channel
A rising channel has been plotted, projecting the potential direction over the next sessions.
Price bouncing inside the lower area of the channel suggests:
The down move might be ending
Momentum could shift toward a bullish correction or even a trend reversal
5. Key Levels Highlighted
Support zone:
4,081.888
4,103.142
Bullish target:
4,220.041
These levels are visually marked and consistent with a reversal strategy.
🧭 Overall Interpretation
This chart proposes a bullish reversal setup, with traders watching for:
A potential liquidity sweep at the support zone
A bounce and consolidation
A climb toward the upper channel area, with 4220 as a projected target
This is a counter-trend reversal idea, so confirmation would be crucial (rejection wicks, bullish candle structures, RSI turning up, etc.).
Gold (XAUUSD) has been in a short-term downtrend, shown by a sequence of lower highs and lower lows.
Price is currently trading around 4113 after a sharp drop.
2. Key Zone: RESISTANCE Turned SUPPORT
The highlighted red zone around 4081 – 4103 is marked as a major support / demand zone.
This appears to be a level where buyers are expected to step in.
The squiggly black arrows indicate a possible liquidity grab or fake breakout before the true move begins.
3. Projected Bullish Recovery
The gray vertical projection box and upward channel lines suggest the author expects:
A bounce from the 4081–4103 support
A move up through the channel
A potential target around 4220, which aligns with the upper boundary of the projected ascending channel.
4. Trend Channel
A rising channel has been plotted, projecting the potential direction over the next sessions.
Price bouncing inside the lower area of the channel suggests:
The down move might be ending
Momentum could shift toward a bullish correction or even a trend reversal
5. Key Levels Highlighted
Support zone:
4,081.888
4,103.142
Bullish target:
4,220.041
These levels are visually marked and consistent with a reversal strategy.
🧭 Overall Interpretation
This chart proposes a bullish reversal setup, with traders watching for:
A potential liquidity sweep at the support zone
A bounce and consolidation
A climb toward the upper channel area, with 4220 as a projected target
This is a counter-trend reversal idea, so confirmation would be crucial (rejection wicks, bullish candle structures, RSI turning up, etc.).

Отказ от ответственности
Информация и публикации не предназначены для предоставления и не являются финансовыми, инвестиционными, торговыми или другими видами советов или рекомендаций, предоставленных или одобренных TradingView. Подробнее читайте в Условиях использования.
Отказ от ответственности
Информация и публикации не предназначены для предоставления и не являются финансовыми, инвестиционными, торговыми или другими видами советов или рекомендаций, предоставленных или одобренных TradingView. Подробнее читайте в Условиях использования.