Spot gold closed last week with a doji candlestick with a long lower shadow, but closed above the 30-week moving average (MA30), indicating a potential rebound. Currently, the weekly MACD indicator is showing a bearish crossover at a high level with increasing volume, and the stochastic oscillator (STO) is near oversold territory, suggesting a continued downward trend. In the short term, we should watch for support around 4415 (MA30), while resistance levels are the high of 4602 and the current middle Bollinger Band and moving average around 4732-4895.
On the daily chart, spot gold is currently consolidating with a low-volume MACD crossover. We need to pay attention to the 5-day moving average; a break above it will likely test the 10-day moving average, and a break above that level would lead to further rebound. However, if it remains below the 10-day moving average, be aware of the risk of a further decline and retesting the lows.
On the 4-hour chart, spot gold is currently in a consolidation phase, with the trading range between 4358 and 4600 (the upper and lower Bollinger Bands).
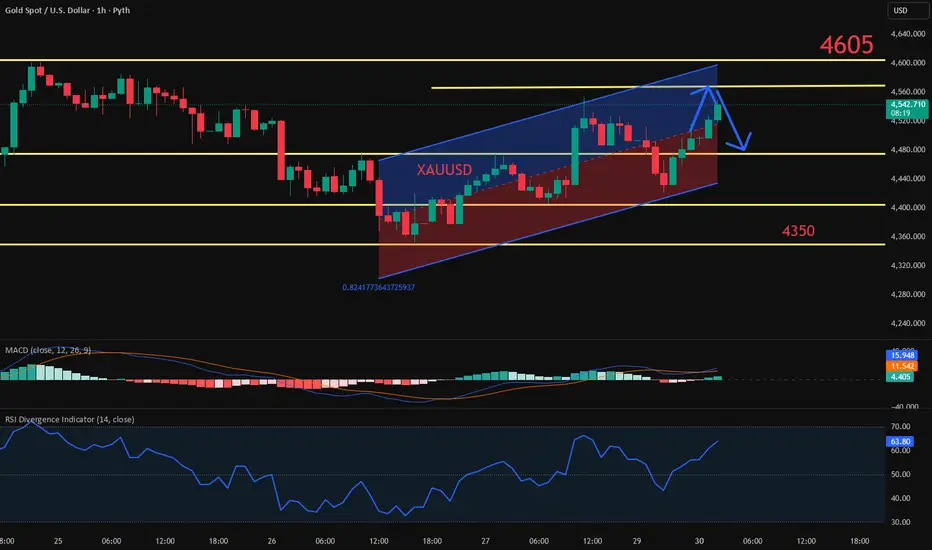
The hourly chart also shows a consolidation pattern. Currently, the 1-hour chart shows an upward channel forming. As long as the channel remains unbroken, the price is considered relatively strong, indicating a short-term tendency towards a rebound.
Since this week is non-farm payroll week, the price is likely to remain range-bound before the release of data. Therefore, it's unlikely to break above 4572 today. We can consider a short position near this level, with key support levels at 4440 and 4410 for potential long opportunities. If this level breaks, consider going long again at 4370 and 4300.
 XAUUSD XAUUSD GOLD
On the daily chart, spot gold is currently consolidating with a low-volume MACD crossover. We need to pay attention to the 5-day moving average; a break above it will likely test the 10-day moving average, and a break above that level would lead to further rebound. However, if it remains below the 10-day moving average, be aware of the risk of a further decline and retesting the lows.
On the 4-hour chart, spot gold is currently in a consolidation phase, with the trading range between 4358 and 4600 (the upper and lower Bollinger Bands).
The hourly chart also shows a consolidation pattern. Currently, the 1-hour chart shows an upward channel forming. As long as the channel remains unbroken, the price is considered relatively strong, indicating a short-term tendency towards a rebound.
Since this week is non-farm payroll week, the price is likely to remain range-bound before the release of data. Therefore, it's unlikely to break above 4572 today. We can consider a short position near this level, with key support levels at 4440 and 4410 for potential long opportunities. If this level breaks, consider going long again at 4370 and 4300.
XAUUSD XAUUSD GOLD 
Отказ от ответственности
Информация и публикации не предназначены для предоставления и не являются финансовыми, инвестиционными, торговыми или другими видами советов или рекомендаций, предоставленных или одобренных TradingView. Подробнее читайте в Условиях использования.
Отказ от ответственности
Информация и публикации не предназначены для предоставления и не являются финансовыми, инвестиционными, торговыми или другими видами советов или рекомендаций, предоставленных или одобренных TradingView. Подробнее читайте в Условиях использования.