
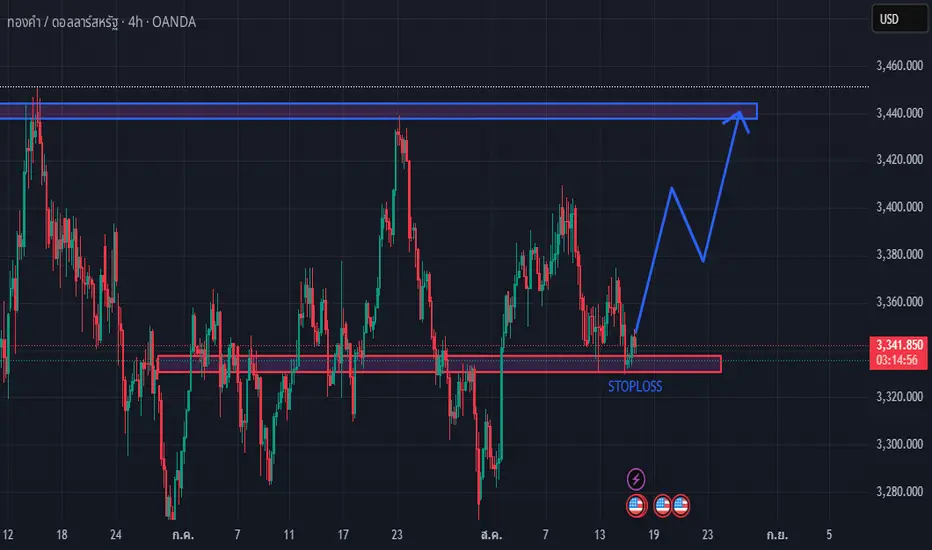
1. Support Zone
Marked in red, around 3340 – 3345.
This level has acted as a strong rebound point multiple times in the past → expected to continue serving as support.
2. Resistance Zone
Marked in blue, around 3430 – 3435.
This is a previous high where price faced strong selling pressure → the main take-profit target.
3. Price Scenario
Price is currently near the red support zone → expected to bounce.
The blue arrow suggests the following movement:
Bounce from support
Small pullback/correction
Continue rising toward the 3430 – 3435 resistance zone
4. Stop-Loss
Placed below the support zone (labeled “STOPLOSS” on the chart), around below 3340.
5. Strategy Implication
This is a buy-at-support setup, with take-profit at resistance and stop-loss below support.
The risk-to-reward ratio is relatively favorable, as the stop-loss range is short compared to the target profit.
Marked in red, around 3340 – 3345.
This level has acted as a strong rebound point multiple times in the past → expected to continue serving as support.
2. Resistance Zone
Marked in blue, around 3430 – 3435.
This is a previous high where price faced strong selling pressure → the main take-profit target.
3. Price Scenario
Price is currently near the red support zone → expected to bounce.
The blue arrow suggests the following movement:
Bounce from support
Small pullback/correction
Continue rising toward the 3430 – 3435 resistance zone
4. Stop-Loss
Placed below the support zone (labeled “STOPLOSS” on the chart), around below 3340.
5. Strategy Implication
This is a buy-at-support setup, with take-profit at resistance and stop-loss below support.
The risk-to-reward ratio is relatively favorable, as the stop-loss range is short compared to the target profit.

Отказ от ответственности
Информация и публикации не предназначены для предоставления и не являются финансовыми, инвестиционными, торговыми или другими видами советов или рекомендаций, предоставленных или одобренных TradingView. Подробнее читайте в Условиях использования.
Отказ от ответственности
Информация и публикации не предназначены для предоставления и не являются финансовыми, инвестиционными, торговыми или другими видами советов или рекомендаций, предоставленных или одобренных TradingView. Подробнее читайте в Условиях использования.