
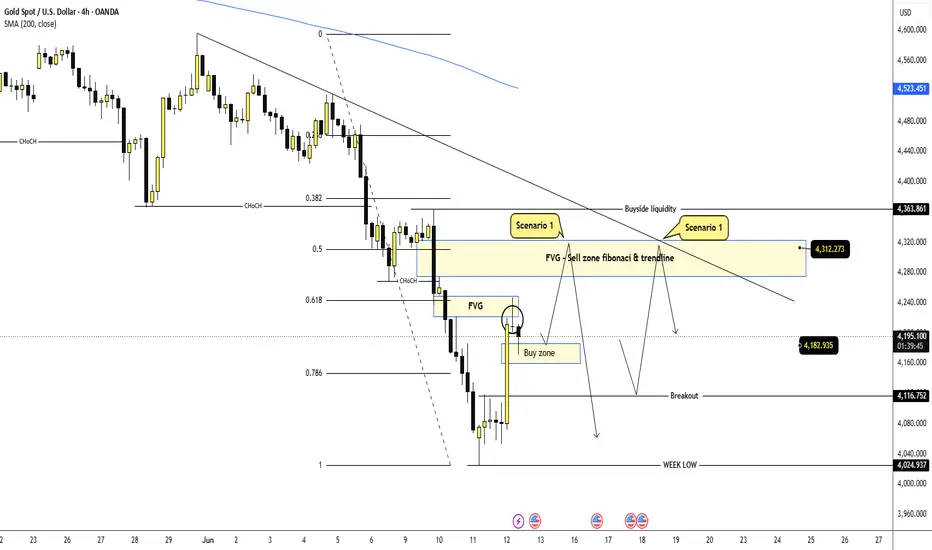
Gold is showing a short-term recovery after sweeping the weekly low area around 4,024. However, the broader H4 structure is still trading under the descending trendline and below the SMA 200, which means the current upside move should be treated as a corrective pullback unless price can break the higher resistance zone clearly.
FUNDAMENTAL ANALYSIS
Gold is still reacting strongly to the U.S. dollar, Treasury yields and upcoming U.S. data. The current rebound looks more like a technical recovery after sweeping lower liquidity, while the broader market has not confirmed a full bullish shift yet.
For now, I prefer using fundamentals as background only and focusing more on price reaction around the key Fibonacci, FVG and trendline zones.
TECHNICAL ANALYSIS – SMC + FIBONACCI
From an SMC perspective, gold has swept the lower liquidity near the weekly low around 4,024 and created a strong rebound. This reaction shows that buyers are active in the lower zone, but price is now approaching a more important decision area above.
The current buy zone around 4,160 – 4,182 is holding as short-term support. As long as price stays above this zone, gold may continue its corrective move toward the FVG and Fibonacci 0.5 area around 4,280 – 4,312.
This upper area is very important because it combines several technical factors: Fibonacci 0.5 retracement, FVG, previous liquidity, and the descending trendline. If price reaches this zone and starts to reject, it may become the main sell reaction area.
The bigger trend is still bearish while gold remains below the trendline and below the 4,363 buyside liquidity. A clean break above the sell zone would weaken the bearish view, but if sellers defend the Fibonacci area, gold may continue lower again toward 4,182, 4,116 and possibly back to the weekly low.
KEY PRICE ZONES TO WATCH
Current price area: 4,194
Short-term support / Buy zone: 4,160 – 4,182
Breakout level: 4,116
Fibonacci 0.5 / FVG sell zone: 4,280 – 4,312
Trendline reaction area: 4,280 – 4,312
Major buyside liquidity: 4,363
Nearest downside target: 4,182
Secondary downside target: 4,116
Weekly low: 4,024
Invalidation area for sell view: Above 4,312 – 4,363
TRADING SCENARIOS
Buy Scenario – Short-Term Recovery View
If gold holds above the 4,160 – 4,182 buy zone, I will watch for a short-term recovery toward the Fibonacci 0.5 area.
Buy Zone: 4,160 – 4,182
Entry Condition: Bullish rejection, liquidity sweep, or lower-timeframe CHoCH.
Stop Loss: Below 4,160 or below the nearest swing low.
Take Profit:
TP1: 4,240
TP2: 4,280
TP3: 4,312
Sell Scenario – Priority Reaction View
If gold reaches 4,280 – 4,312 and shows rejection, I will watch for a sell reaction from the Fibonacci 0.5, FVG and trendline confluence.
Sell Zone: 4,280 – 4,312
Entry Condition: Bearish rejection, failed breakout, or lower-timeframe CHoCH.
Stop Loss: Above 4,312 or above the nearest swing high.
Take Profit:
TP1: 4,182
TP2: 4,116
TP3: 4,024
Alternative Scenario
If gold breaks below 4,160 – 4,182 with strong momentum, the recovery idea becomes weaker and sellers may return earlier.
Sell Condition: Wait for a clean break and retest below the buy zone.
Target: 4,116 – 4,024
MY VIEW ON GOLD
My current view is that gold may continue its short-term recovery first, with the main upside area sitting around 4,280 – 4,312. This is the zone where I will watch sellers carefully because it combines Fibonacci 0.5, FVG and the descending trendline.
The cleaner plan is not to chase price in the middle. I prefer watching two reactions on the smaller timeframe: first, whether buyers can hold 4,160 – 4,182 for a move higher; second, whether sellers appear strongly around 4,280 – 4,312.
Overall, gold can still recover in the short term, but the main structure remains bearish unless price breaks above the trendline and holds above the sell zone.
Do you think gold will reach the 4,280 – 4,312 Fibonacci zone before sellers react again?
Сделка активна
Active Buy zone ,already made a profit
Trading is a journey. The destination is mastering yourself
t.me/+qqEvv7Li9Tg2NTE1
t.me/+qqEvv7Li9Tg2NTE1
Похожие публикации
Отказ от ответственности
Информация и публикации не предназначены для предоставления и не являются финансовыми, инвестиционными, торговыми или другими видами советов или рекомендаций, предоставленных или одобренных TradingView. Подробнее читайте в Условиях использования.
Trading is a journey. The destination is mastering yourself
t.me/+qqEvv7Li9Tg2NTE1
t.me/+qqEvv7Li9Tg2NTE1
Похожие публикации
Отказ от ответственности
Информация и публикации не предназначены для предоставления и не являются финансовыми, инвестиционными, торговыми или другими видами советов или рекомендаций, предоставленных или одобренных TradingView. Подробнее читайте в Условиях использования.