
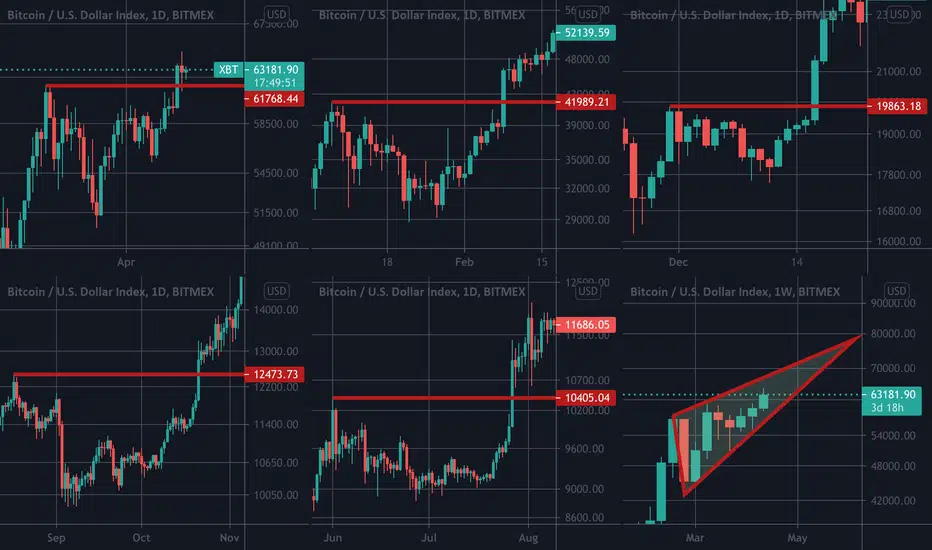
The first 5 charts are daily charts and show Bitcoin’s reactions to its resistance levels during this Bullish rally.
The last chart is weekly chart of Bitcoin.
There is a difference between the most recent and the previous four times that Bitcoin passed its resistance, can you identify what is that
Share your answer in the comments
The last chart is weekly chart of Bitcoin.
There is a difference between the most recent and the previous four times that Bitcoin passed its resistance, can you identify what is that
Share your answer in the comments

Use the following link to access trading ideas: patreon.com/SniperTraderStocks?utm_medium=unknown&utm_source=join_link&utm_campaign=creatorshare_creator&utm_content=copyLink
Отказ от ответственности
Информация и публикации не предназначены для предоставления и не являются финансовыми, инвестиционными, торговыми или другими видами советов или рекомендаций, предоставленных или одобренных TradingView. Подробнее читайте в Условиях использования.
Use the following link to access trading ideas: patreon.com/SniperTraderStocks?utm_medium=unknown&utm_source=join_link&utm_campaign=creatorshare_creator&utm_content=copyLink
Отказ от ответственности
Информация и публикации не предназначены для предоставления и не являются финансовыми, инвестиционными, торговыми или другими видами советов или рекомендаций, предоставленных или одобренных TradingView. Подробнее читайте в Условиях использования.