
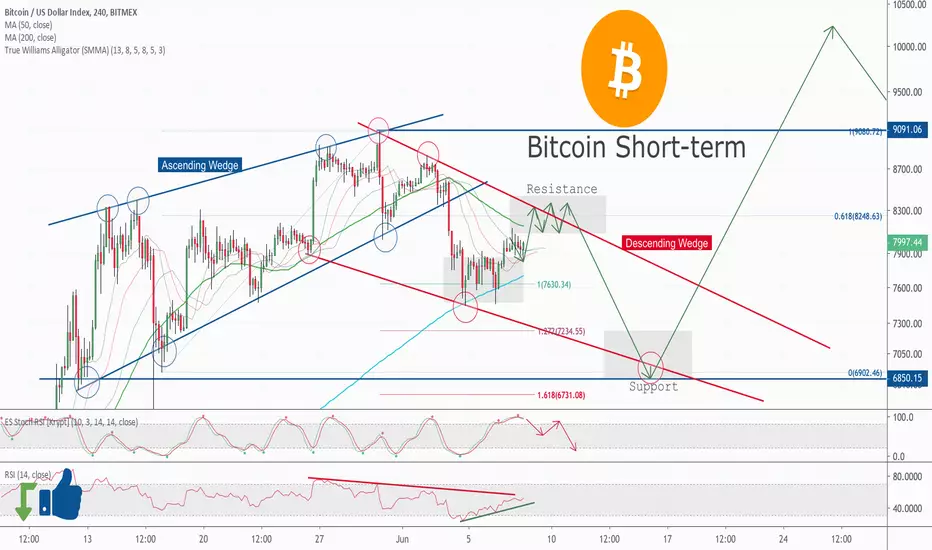
Hello, Artem is back! Here we are on XBT chart, it showing us two types of wedges: Ascending Wedge on the left with dark blue colors, and Descending Wedge on the right with red colors.
Now we in a middle of descending wedge, rebounding from dynamic support *7600$ and going to resistance area of 0.618 Fib at around 8250$.
Stochastic RSI already topped and looks like I will make lower high, while price will hit higher to 8250$ to complete local bearish divergence. So this will be our signal for rebound and reentry for longs I expect around 6800$ support level.
If something will opposite to this idea we should be ready, so our bullish breakout should be supported by breaking out from 9000$ level. Bearish breakout should be supported by 6800$ breakdown.
Good luck and feel free to share your ideas to make any contribution to this analysis.
Now we in a middle of descending wedge, rebounding from dynamic support *7600$ and going to resistance area of 0.618 Fib at around 8250$.
Stochastic RSI already topped and looks like I will make lower high, while price will hit higher to 8250$ to complete local bearish divergence. So this will be our signal for rebound and reentry for longs I expect around 6800$ support level.
If something will opposite to this idea we should be ready, so our bullish breakout should be supported by breaking out from 9000$ level. Bearish breakout should be supported by 6800$ breakdown.
Good luck and feel free to share your ideas to make any contribution to this analysis.

Отказ от ответственности
Информация и публикации не предназначены для предоставления и не являются финансовыми, инвестиционными, торговыми или другими видами советов или рекомендаций, предоставленных или одобренных TradingView. Подробнее читайте в Условиях использования.
Отказ от ответственности
Информация и публикации не предназначены для предоставления и не являются финансовыми, инвестиционными, торговыми или другими видами советов или рекомендаций, предоставленных или одобренных TradingView. Подробнее читайте в Условиях использования.