
The pull back of yesterday could be over!
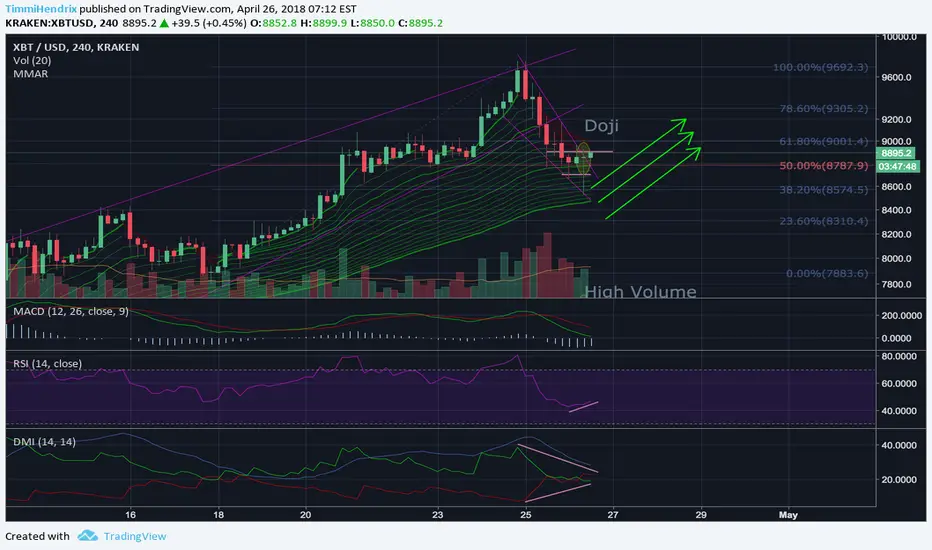
We see a huge Doji candle with a high volume which indicates a reversal. This Doji formed at 50% fibonacci level --> Bounce off this support level.
Additionaly we broke thru the down trend line of the falling wedge. This gives us also a signal to go long.
RSI stopped going down and shows us a consolidation. DMI shows gives us the same signal.
If we break thru the double bottom neckline on 30min Chart at 8900 we should expect a continuation of the uptrend for short term which will tell us if the up trend on 4h has enough power to go further.
Here the 30min Chart:

We see a huge Doji candle with a high volume which indicates a reversal. This Doji formed at 50% fibonacci level --> Bounce off this support level.
Additionaly we broke thru the down trend line of the falling wedge. This gives us also a signal to go long.
RSI stopped going down and shows us a consolidation. DMI shows gives us the same signal.
If we break thru the double bottom neckline on 30min Chart at 8900 we should expect a continuation of the uptrend for short term which will tell us if the up trend on 4h has enough power to go further.
Here the 30min Chart:
Заметка
It's on!If the this 30min candle closes above 8900 we're up again!
Заметка
Almost did it, but we're still on!
Заметка
Still in consolidation phase. Waiting for price action..Заметка
Seems like we're on track!Заметка
Next resistance @ 9600Can we break it?

Отказ от ответственности
Информация и публикации не предназначены для предоставления и не являются финансовыми, инвестиционными, торговыми или другими видами советов или рекомендаций, предоставленных или одобренных TradingView. Подробнее читайте в Условиях использования.
Отказ от ответственности
Информация и публикации не предназначены для предоставления и не являются финансовыми, инвестиционными, торговыми или другими видами советов или рекомендаций, предоставленных или одобренных TradingView. Подробнее читайте в Условиях использования.