Длинная
XLM is Bullish
SWING TRADING ANALYSIS
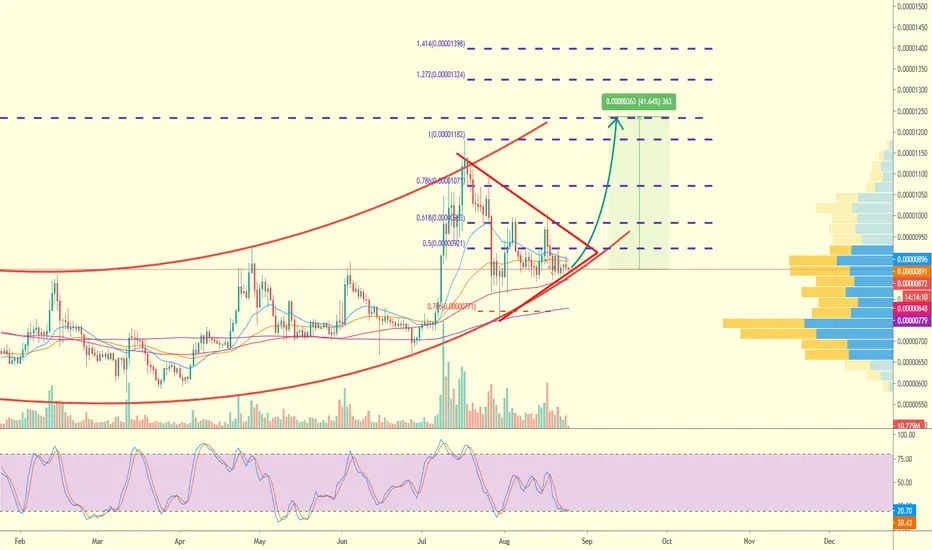
XLM in the bullish channel(red lines) right know, it can higher because the volume of accumulation is high in currently price, you can see it from the spike of volume profile
The decreasing of volume is a sign that it will pump in a days
The oscilator showed the price is currenctly low, that means it is oversold right know
Trading plan :
Entry : 850 - 890
Target 1 : 1074
Target 2 : 1186
Target 3 : 1238
Target 4 : 1328
Stop loss : 800
Enjoy the profit later 🤑🤑🤑
XLM in the bullish channel(red lines) right know, it can higher because the volume of accumulation is high in currently price, you can see it from the spike of volume profile
The decreasing of volume is a sign that it will pump in a days
The oscilator showed the price is currenctly low, that means it is oversold right know
Trading plan :
Entry : 850 - 890
Target 1 : 1074
Target 2 : 1186
Target 3 : 1238
Target 4 : 1328
Stop loss : 800
Enjoy the profit later 🤑🤑🤑

Отказ от ответственности
Информация и публикации не предназначены для предоставления и не являются финансовыми, инвестиционными, торговыми или другими видами советов или рекомендаций, предоставленных или одобренных TradingView. Подробнее читайте в Условиях использования.
Отказ от ответственности
Информация и публикации не предназначены для предоставления и не являются финансовыми, инвестиционными, торговыми или другими видами советов или рекомендаций, предоставленных или одобренных TradingView. Подробнее читайте в Условиях использования.