
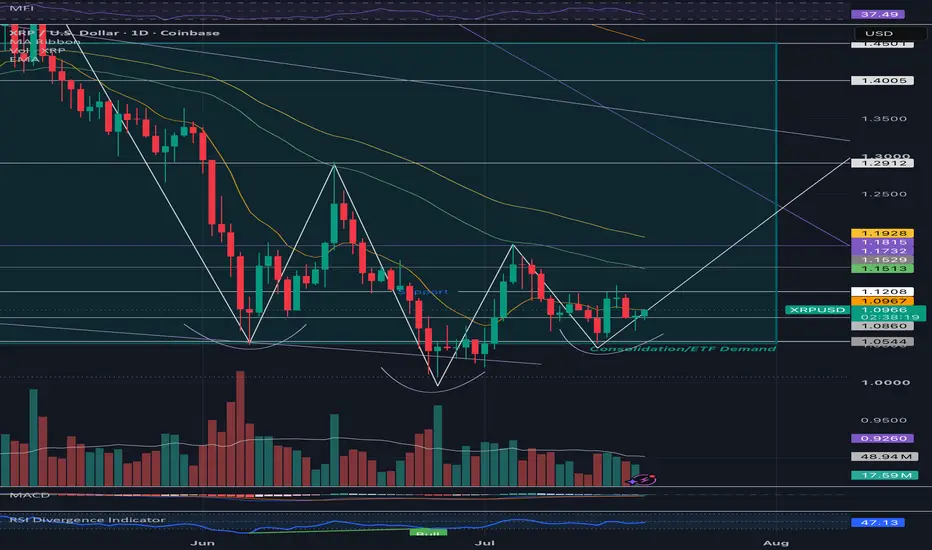
XRP Technical Summary (Daily Chart – ~$1.09)
XRP is infalling wedge consolidation around the $1.08–$1.10 zone, with price coiling between converging downward-sloping trendlines. This bullish pattern shows narrowing volatility after the longer-term decline, with the green “Consolidation/ETF Demand” box highlighting strong institutional support near $1.05–$1.15.
Overlaying this is a potential inverse head & shoulders forming:
• Head at the recent low (~$1.05–$1.07).
• Shoulders on either side with higher lows.
• Neckline at ~$1.10–$1.12.
Key Levels:
• Support: $1.05–$1.07 (wedge bottom + demand zone).
• Breakout trigger: Close above $1.10–$1.12 (confirms inverse H&S + wedge breakout).
• Resistance: $1.15 → $1.18–$1.20.
• Targets (measured moves): $1.25–$1.35 (initial), $1.45–$1.55+ on full wedge expansion.
XRP is infalling wedge consolidation around the $1.08–$1.10 zone, with price coiling between converging downward-sloping trendlines. This bullish pattern shows narrowing volatility after the longer-term decline, with the green “Consolidation/ETF Demand” box highlighting strong institutional support near $1.05–$1.15.
Overlaying this is a potential inverse head & shoulders forming:
• Head at the recent low (~$1.05–$1.07).
• Shoulders on either side with higher lows.
• Neckline at ~$1.10–$1.12.
Key Levels:
• Support: $1.05–$1.07 (wedge bottom + demand zone).
• Breakout trigger: Close above $1.10–$1.12 (confirms inverse H&S + wedge breakout).
• Resistance: $1.15 → $1.18–$1.20.
• Targets (measured moves): $1.25–$1.35 (initial), $1.45–$1.55+ on full wedge expansion.

Отказ от ответственности
Информация и публикации не предназначены для предоставления и не являются финансовыми, инвестиционными, торговыми или другими видами советов или рекомендаций, предоставленных или одобренных TradingView. Подробнее читайте в Условиях использования.
Отказ от ответственности
Информация и публикации не предназначены для предоставления и не являются финансовыми, инвестиционными, торговыми или другими видами советов или рекомендаций, предоставленных или одобренных TradingView. Подробнее читайте в Условиях использования.