
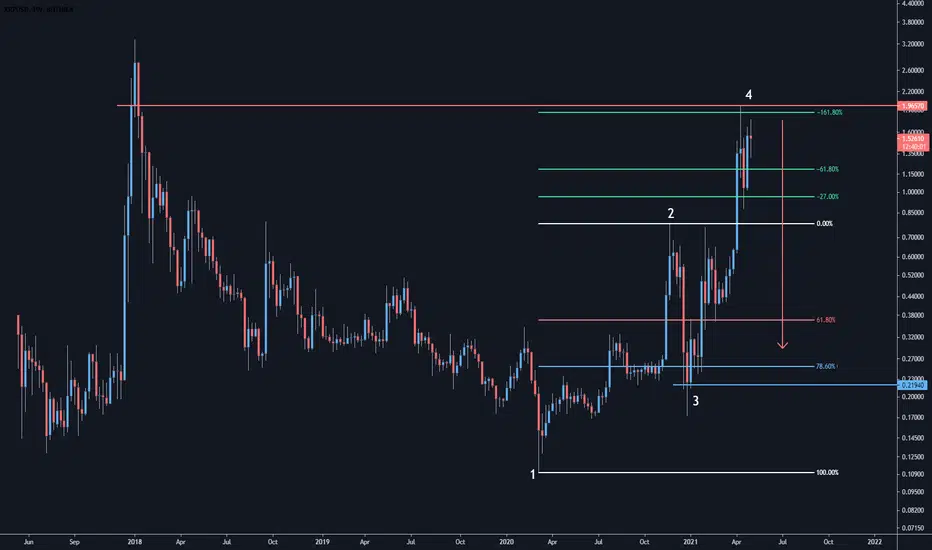
Following the previous post of the Monthly Timeframe, this Weekly Fibonacci further validates why $1.96 is a rejection zone.
The -161.8% Extension aligns with the Dec 2017 / Jan 2018 candle closes where we have tapped it perfectly.
I would anticipate that the next move would be back towards 61.8% and 78.6% retracements where we can identify the next set up.
I will post a Daily Timeframe analysis of this bias to complete the full top-down analysis which shows more confirmations.
The -161.8% Extension aligns with the Dec 2017 / Jan 2018 candle closes where we have tapped it perfectly.
I would anticipate that the next move would be back towards 61.8% and 78.6% retracements where we can identify the next set up.
I will post a Daily Timeframe analysis of this bias to complete the full top-down analysis which shows more confirmations.
Заметка
Monthly Analysis - 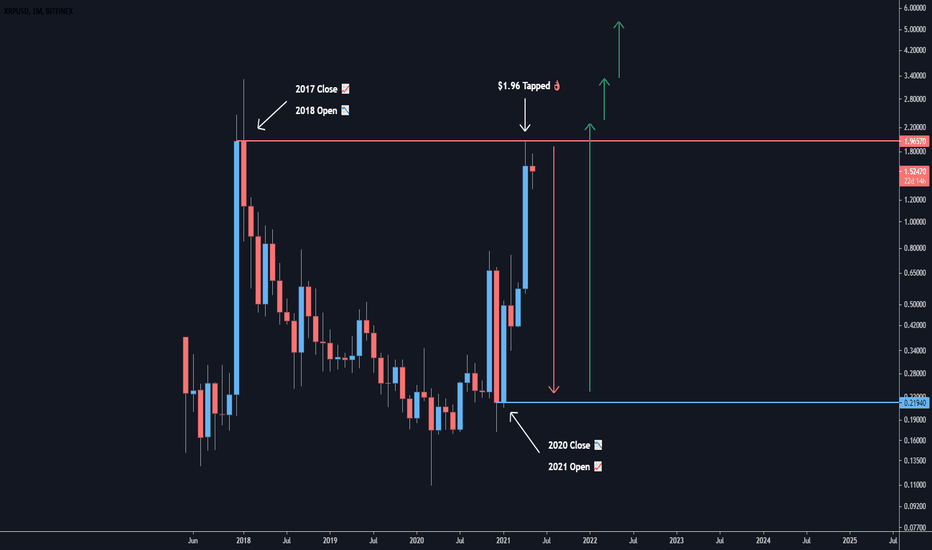
Заметка
Daily Analysis - 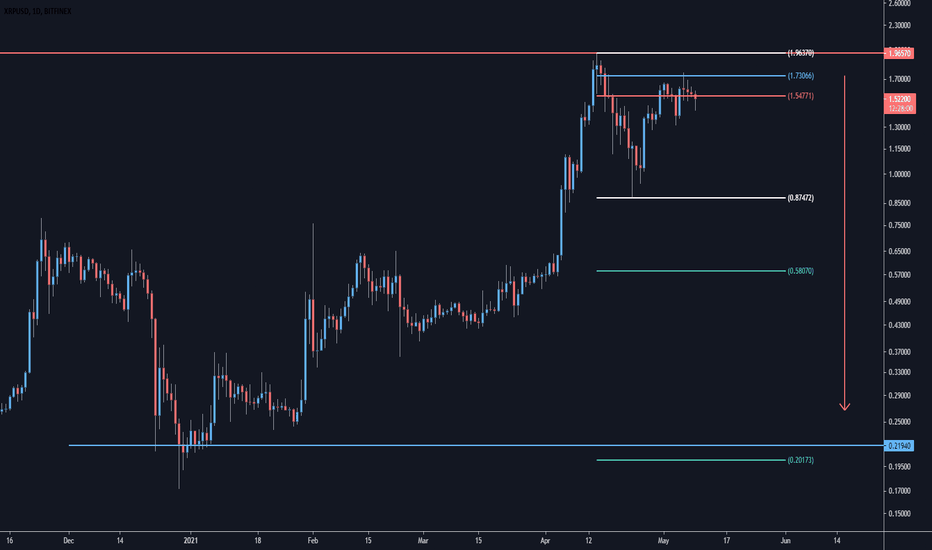

Отказ от ответственности
Информация и публикации не предназначены для предоставления и не являются финансовыми, инвестиционными, торговыми или другими видами советов или рекомендаций, предоставленных или одобренных TradingView. Подробнее читайте в Условиях использования.
Отказ от ответственности
Информация и публикации не предназначены для предоставления и не являются финансовыми, инвестиционными, торговыми или другими видами советов или рекомендаций, предоставленных или одобренных TradingView. Подробнее читайте в Условиях использования.