YFIBTC - Case for Bulls
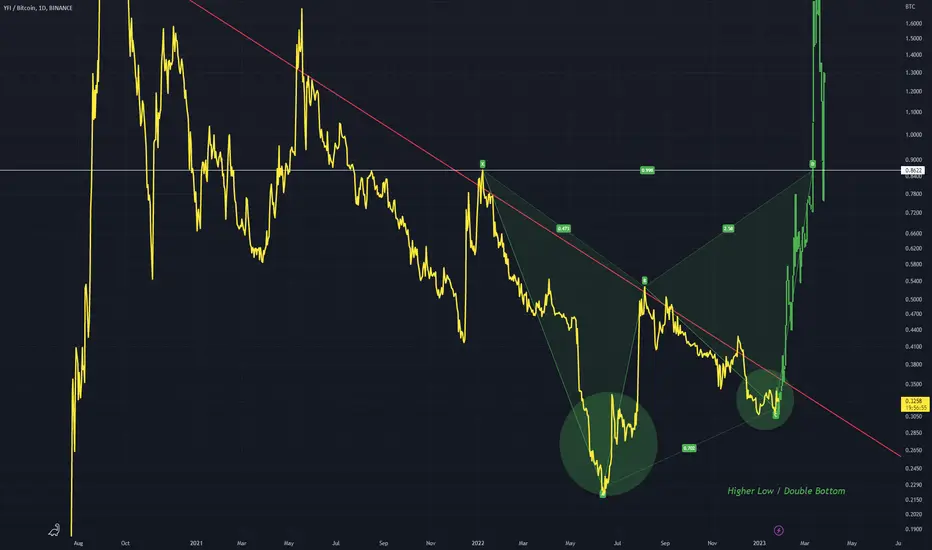
Currently this red trendline is dominant and should be considered when looking at this chart, as the dominant trend is down.
Ill give it a shot at picking the bottom though. A higher low and subsequent double bottom is a good candidate for a potential reversal
The ABCD pattern shows my thought process when looking at this chart structure
If price breaks down when the red line is hit then the bears are in control, but if it does breakout I expect it to move to D
Ill give it a shot at picking the bottom though. A higher low and subsequent double bottom is a good candidate for a potential reversal
The ABCD pattern shows my thought process when looking at this chart structure
If price breaks down when the red line is hit then the bears are in control, but if it does breakout I expect it to move to D

Отказ от ответственности
Информация и публикации не предназначены для предоставления и не являются финансовыми, инвестиционными, торговыми или другими видами советов или рекомендаций, предоставленных или одобренных TradingView. Подробнее читайте в Условиях использования.
Отказ от ответственности
Информация и публикации не предназначены для предоставления и не являются финансовыми, инвестиционными, торговыми или другими видами советов или рекомендаций, предоставленных или одобренных TradingView. Подробнее читайте в Условиях использования.