
Hello friends
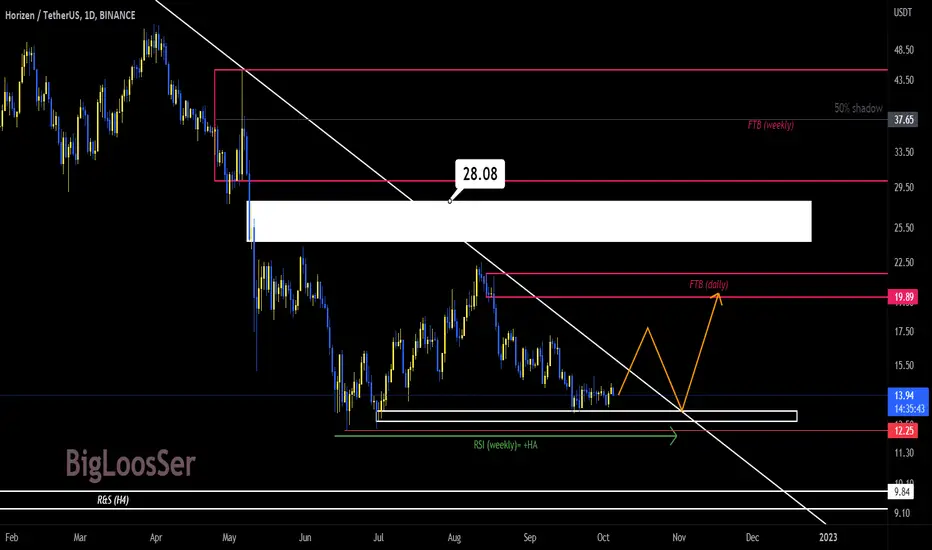
The positive divergence of the RSA in the weekly chart and the downward trend line , which the price is just below, is an interesting combination, isn't it!?
If the $12.25 range is maintained in the current trend and the upward trend is placed above the $17.2 price range, the long-term downward trend line will be broken upwards.
In this case, we can expect an increasing trend in the medium term.
What do you think?

Отказ от ответственности
Информация и публикации не предназначены для предоставления и не являются финансовыми, инвестиционными, торговыми или другими видами советов или рекомендаций, предоставленных или одобренных TradingView. Подробнее читайте в Условиях использования.
Отказ от ответственности
Информация и публикации не предназначены для предоставления и не являются финансовыми, инвестиционными, торговыми или другими видами советов или рекомендаций, предоставленных или одобренных TradingView. Подробнее читайте в Условиях использования.