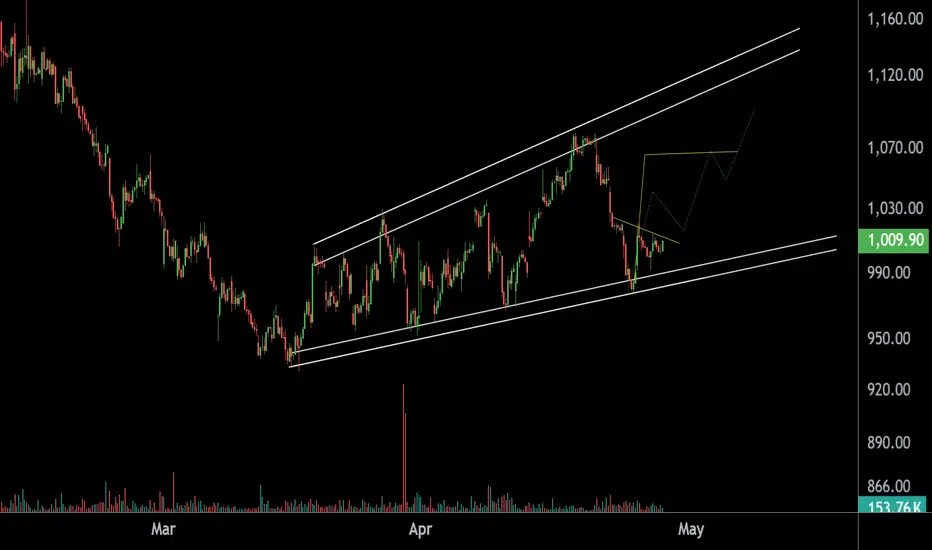
TMCV's Hidden Pattern Finally RevealedFalling Wedge Setup
Stock is trading within a falling wedge pattern with resistance near 400-405 and support at 340-350.
Breakout above 405 can trigger fresh bullish momentum.
Any dip towards 340-350 may offer a buying opportunity.
Pattern is almost complete; wait for breakout confirmation or support retest.
Mid-Term Target: 450+
Broadening Wedge
is HYPE (hyperliquid) overbought? -SHORT-🙋♀️🙋♂️😃🌍🐮 Hello all 🙋♀️🙋♂️😃🌍🐮
I would like to say I am overall still bearish 🐻🐻❄️🐨🐼 on the market for now as bitcoin fell below a key price of 77k and has continued to fall, I have had my eyes set on 59k BTC price for a couple of months now to finish out the perfect bear market (see previous ideas for more information)
HYPE reached a new ATH of 67 dollars during the crashing market today which is impressive and perpetual futures trades have seen billions of dollars worth of volume. That being said, I believe it is extremely overpriced in a bearish market and is due for a correction.
My target is on .618 fib retracement of its most recent bullish impulse (around 49 dollars as a target) this also market the spot of a longstanding trendline support.
On the 4 hour chart the price has created a broadening ascending wedge , with large wicks near the top of the structure,
Lets see ⏰🤸♂️🐳 this has potential to be a nice short but remember
👇👇👇👇👇
Always have a stop loss ✋🛑💲 set🆗
This is not financial advice
Any thoughts 💭💡, questions 🙋♀️🙋♂️❓, good 👍, bad👎, happy 😄 or sad 😥, in the comments always welcome.😄
Thank you so much ⭐
Jazerbay ☯️
HDFC BANK Preparing for a Strong Upside Move | Bulls Regaining CHDFC BANK Analysis
HDFC Bank is currently holding a strong support zone near 745 – 750, which is acting as an important demand area for the stock.
The stock is also forming a Descending Broadening Pattern, indicating increasing volatility and the possibility of a strong directional move ahead.
As long as the support zone remains intact, the probability of an upside breakout and bullish momentum continues to remain strong.
Keep an eye on price action near resistance levels for confirmation of the next major move
RBL BANK Showing Strong Momentum | Bulls Back in ActionRBL BANK | 1-Hour Timeframe Analysis
RBL Bank is currently showing strong momentum on the 1-hour timeframe and forming a bullish Higher High – Higher Low (HH-HL) structure, indicating positive price strength.
The stock is also developing a Broadening Wedge pattern, with a key resistance zone placed near 370 – 375 levels. Interestingly, the previous Higher High resistance is also positioned around the same zone, making it an important breakout area to watch.
On the downside, the stock has a strong structural support zone near 330 – 340 range, which may act as a demand area during any pullback.
Bullish view will become invalid below 320, as this level represents the last major structural support.
Silver Crashes 18% – Is a Relief Rally Finally Coming?On Friday, in my Silver analysis, I wrote that after testing the major 90 resistance zone, the market could eventually pull back toward the 83 support area.
However, what followed exceeded even my expectations.
Silver didn’t simply correct.
It absolutely collapsed.
The price dropped more than 15k pips, which translated into percentage terms means roughly an 18% decline — an enormous move even for an asset as naturally volatile as Silver.
Just like Gold, the new week started with another wave of panic selling during the Asian session, pushing Silver slightly below the 74 figure before buyers finally stepped in and triggered a recovery.
At the time of writing, the market is attempting to stabilize after the aggressive sell-off.
Medium-Term Perspective
From a broader technical point of view, the medium-term structure now clearly shifted bearish.
The violence of the recent decline changed the overall picture significantly, and for now rallies should be treated carefully rather than blindly trusted.
However, when we zoom into the 1-hour chart, something interesting starts to appear:
➡️ a descending broadening wedge formation.
This type of structure often signals instability and exhaustion and, quite frequently, can precede a short-term reversal move.
That does not automatically mean “new bull market.”
But it does suggest that the market may need a stronger corrective rebound after such an extreme decline.
Trading Plan
As long as the 74 zone continues to hold, short-term traders could look for buying opportunities targeting a recovery toward the 80 area.
But there is one very important thing to keep in mind:
just like in Gold’s case, buying Silver at this moment means trading against the broader trend.
And countertrend trades require:
- smaller volume
- faster reactions
- lower ego
- and less romantic attachment to the position
Because after an 18% collapse, Silver may bounce hard…
but it can also remind everyone very quickly why knives are not supposed to be caught 🚀
NAUKRI in Focus – Structure Intact, Momentum Ahead?The stock is currently forming an Ascending Broadening Wedge pattern.
Support Level:
The lower trendline is acting as a strong support zone. As long as this support sustains, the structure remains intact.
Upside View:
If the support holds, a potential upside move towards 1,070 – 1,100 can be expected.
A breakdown below support may invalidate this view.
Thank You !!
$EURUSD - $1.18 as a decisive levelHi guys! 👋
🔔 EURUSD is at 1.1690 and the market is stuck. It bounced hard off the March lows at 1.1407, gained over 200 pips in a week when the ceasefire headlines hit, and now it's sitting right under the one level that matters — 1.1820.
🔔 Break it and hold it, this goes to 1.2000 and potentially 1.2500. Can't break it, and 1.1200–1.1180 becomes the next stop.
🔔 What followed in early 2025 was a strong impulsive move — clean, fast, technically valid — that broke price above the mid-range of the triangle and ran all the way to 1.2000. That impulse matters.
🔔 The problem is the ascending broadening wedge sitting on top of it. Higher highs, higher lows, but the boundaries are expanding not tightening.
🔔 The MA50 crossed below the MA200. That's a Death Cross, it's confirmed, and it's sitting right where price is trading now. You're basically trading inside the moving average cluster, which means every candle from here is a fight between the bulls trying to reclaim it and the bears defending it.
🔔 The 50% level is where the market tends to find genuine buyers after a corrective move, and the bounce off it has been real. The question is whether that bounce has enough behind it to take out 1.1820 or whether it fades into the moving average cluster and rolls over.
Bias : Retest $1.182 and go down to $1.11
Invalidation : If closes above $1.182, which will lead to another jump to $1.20
✊ Good luck with your trades! ✊
• If you like the idea, hit the 🚀 button
• Please ✍️ your thoughts in the Comments section
• And follow me for more updates.
Biocon Forming a Broadening Pattern ! Volatility AheadBiocon – Daily Timeframe Analysis:
On the daily timeframe, the stock is showing a strong support zone in the range of 330–340, while immediate resistance is placed near the 389–390 levels.
A sustained move above resistance or a hold at support may provide further directional clarity.
Thank you.
Reliance Approaching Crucial Reversal ZoneThe stock is currently forming a broadening wedge pattern and is trading near the lower boundary (support zone) of the structure. This level becomes crucial from a technical perspective.
If the support holds, it may offer a favorable opportunity for investors to consider positional accumulation, as the pattern suggests a potential reversal setup.
On the upside, a sustained bounce from this zone could lead to an initial move towards the 1400 level, which coincides with the resistance of the short-term falling channel. Additionally, this zone is further reinforced by the confluence of key EMA levels, making it a strong resistance cluster.
Hence, price behavior near the current support will be critical in determining the next directional move.
THANK YOU
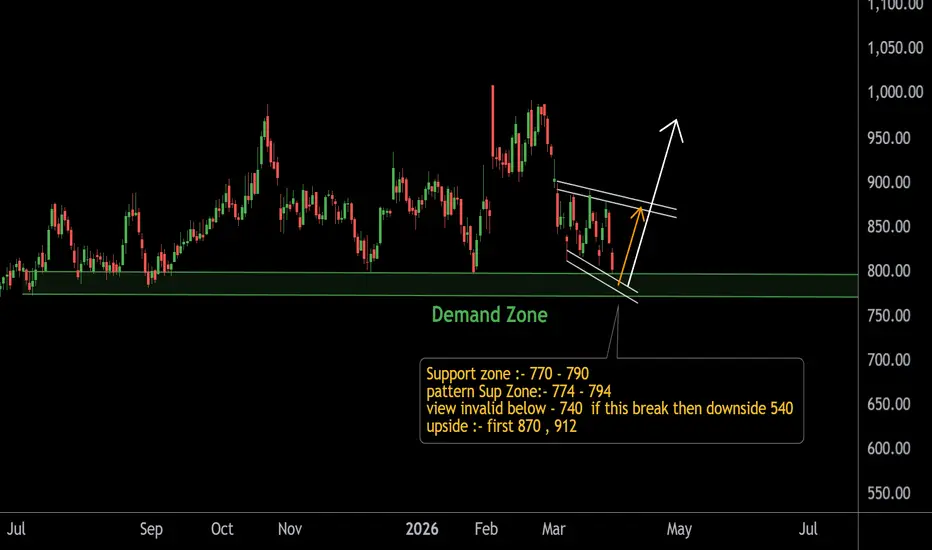
NAM_INDIA Key Demand Zone – Make or Break Levels AheadThis is the higher time frame view showing a strong demand zone around 770 – 790, where price has reacted multiple times in the past.
Key Observations:
• Price is currently trading near a falling channel pattern
• Testing an important demand/support zone
• Compression near support hints at a possible volatility expansion ahead
Important Levels:
• Support Zone: 770 – 790
• Pattern Support: 774 – 794
• Invalidation Level: Below 740 (strong bearish continuation possible)
Upside Potential:
• First Target: 870
• Next Target: 912
Bearish Scenario:
If the price breaks and sustains below 740, we may see a sharp downside move towards 540 levels.
Thank You ....
Natural Gas – Short-Term Market OutlookThis is the 15-minute timeframe chart of Natural Gas.
Natural Gas is currently trading near an important support zone of 284–286. If this level holds, we can expect a short-term bounce towards the 305–312 levels.
The breakout level is 297—once the price sustains above this level, the market is likely to move towards the mentioned targets.
However, if the price breaks below the support zone, it may lead to further downside pressure in the market.
It is advised to wait for confirmation before taking any position and trade with proper risk management.
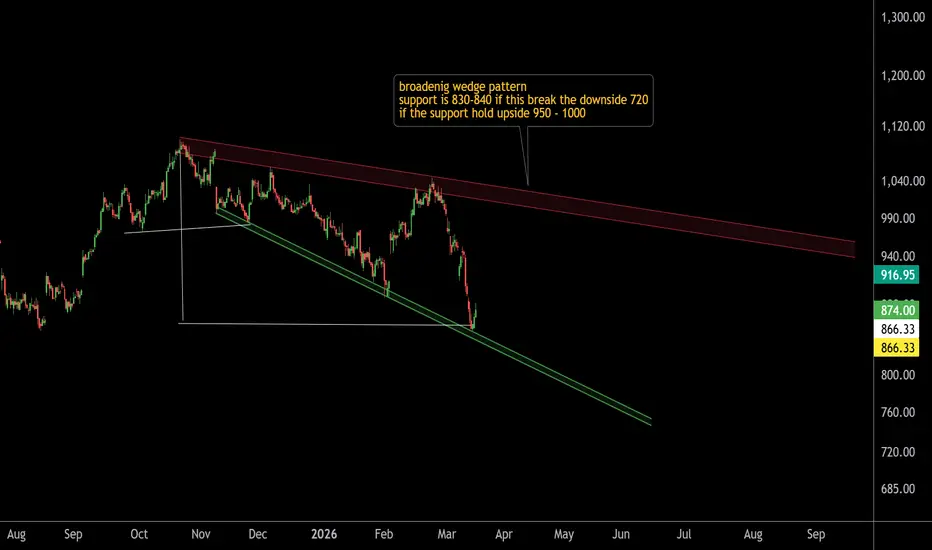
BAJFINANCE Near Important Pattern Support ZoneThis is the 4-hour timeframe chart of Bajaj Finance.
The stock is currently trading near a key pattern support zone around 830–840.
If this support zone holds and the price sustains above it, the stock may move toward the pattern resistance zone of 950–1000.
However, if this support level breaks, the downside pattern target could extend toward the 720 level.
THANK YOU
HIMATSEIDE | Last Leg in Formation – Watch Closelythe stock is forming a dual pattern across two different timeframes.
A strong demand zone is clearly visible on both charts, with the same support range between 80–95, reinforcing the reliability of this base.
On the higher timeframe, the structure reflects a Symmetrical Triangle formation. while the intermediate timeframe shows a Broadening Wedge,
The key resistance levels to watch are:
₹200 near the upper boundary of the triangle
₹300 near the broadening wedge resistance
Historically, whenever this support zone has sustained, the stock has gone on to register new highs.
As long as price holds above the base, the broader structure remains bullish and continuation is favored, subject to confirmation by price action.
thank you ..
ROAD TO 15 CENTS (4h)ROAD TO 15 CENTS
We can be hopeful that after breaking out of the wedge, we will see significant price growth.AB=CD
Best regards CobraVanguard.💚
Give me some energy !!
✨We spend hours finding potential opportunities and writing useful ideas, we would be happy if you support us.
Best regards CobraVanguard.💚
ICICIPRULI–Short-Term Breakout.Mid & Long-Term Technical OutlookICICIPRULI – Multi-Timeframe Technical View
Daily Timeframe | Long-Term Perspective
ICICIPRULI is trading within a well-defined structure and continues to move inside a clear parallel channel, reflecting a healthy long-term trend.
The stock has a strong long-term support zone near 590–610, where:
Volume expanded significantly
Price showed a clear reversal from support
Historically, the stock has delivered returns of ~60% and ~34% from similar structures.
If price action repeats this nature, a long-term upside toward 780 and 940 remains a strong possibility.
Mid-Term View | Structure & Pattern
On the mid-term timeframe, the stock previously formed a falling wedge near the support zone, indicating accumulation.
Post that, ICICIPRULI appears to be developing an ascending broadening formation, suggesting expanding momentum.
Key Levels:
Support: 620–630
Short- to Mid-term Resistance / Target: 680–700
Nykaa Holds Key Support as Bullish Momentum BuildsThis is the daily timeframe chart of Nykaa.
The stock is currently trading near its LOP support zone around ₹240.
If this support level sustains, a move towards higher price levels may be expected, with immediate resistance placed near ₹280.
Thank you.
CAMS at Crucial Support | Smart Money ZoneThis is the daily timeframe chart of CAMS.
The stock is moving within a falling channel and is currently trading near the support zone.
Upper boundary of the channel: 720
Lower boundary of the channel: 680
Channel resistance zone: 775–800
If this support zone sustains, we may see higher prices again in CAMS in the coming sessions.
Thank you.
Expanding Correction Before a Potential Bullish ImpulseBrent crude has been developing inside a broadening / expanding corrective structure after the previous impulsive decline.
The volatility within this formation suggests indecision, yet the overall flow still fits the classic sequence of:
Impulse → Expanding Correction → Potential Next Impulse.
From a technical perspective, price has repeatedly respected the boundaries of the expanding structure, building a base of higher lows and compressing toward a breakout zone. A confirmed break above the upper trend line would unlock bullish momentum, with the 66.80–67.00 region standing out as the first major target due to unfilled inefficiencies and prior liquidity clusters.
What reinforces this scenario is that multiple technical analysts currently view the ongoing consolidation as a corrective phase rather than the start of a new bearish trend. Several independent traders identify the same broadening pattern, expecting a bullish expansion once the correction completes.
Fundamentally, short-term sentiment also supports the possibility of a rebound. Demand forecasts have recently stabilized, OPEC+ continues to manage supply conditions, and weekly inventory fluctuations have provided intermittent support for crude. These factors often allow corrective structures to resolve upward before broader macro trends take over.
At the institutional level, Goldman Sachs projects Brent to average near the mid-66s in the second half of 2025, aligning closely with the structural target from this chart. However, it is worth noting that EIA and S&P Global caution that global supply could still outweigh demand later on—meaning any bullish impulse may be limited unless fundamental conditions shift.
In summary:
The market structure supports a bullish breakout scenario.
Technical analysts widely agree on the expanding correction framework.
Short-term fundamentals allow for a recovery toward 66–67.
Longer-term outlook remains mixed, so managing risk above key resistance is essential.
This is an observational analysis, not financial advice.
HindCopper Showing Strong Momentum; Breakout Setup DevelopingDaily Timeframe Analysis – HindCopper
HindCopper is forming a broadening wedge pattern on the daily timeframe, with a key support zone around ₹300. The stock has completed its five-wave structure and is currently showing strong upward momentum.
If this momentum sustains and the price breaks above the ₹375–₹380 resistance zone, the stock could move toward the pattern target near ₹450.
Additionally, as long as the momentum support around ₹340 holds, the probability of higher levels remains strong.
Thank you.
Sun TV: Critical Levels Setting Up the Next MoveThis is the 1-hour timeframe chart of Sun TV.
The stock is forming a Descending Broadening Wedge pattern with a support zone near ₹515–525 and resistance around ₹565–575.
The trend is currently negative, but if the price breaks above the resistance zone, the stock may move toward the
pattern target near ₹620.
Thank you.
Major Pattern Formation in Rain IndustriesThis is the weekly timeframe chart of Rain Industries.
The stock is forming a Bow & Tie pattern on the long-term timeframe and is currently trading near the key support zone around ₹100.
The major support level near ₹80, based on the EMA, remains crucial.
If this support holds, the stock has the potential to move toward new highs in the coming sessions.
Thank You !!
Breaking: Broadcom Inc. (AVGO) Surged 11% Yesterday Eyeing $500 Broadcom Inc. (NASDAQ; NASDAQ:AVGO ) shares saw a noteworthy uptick of 11% in extended market trading further extending the gains to todays premarket session up by 2.34%.
Should the stock break the ceiling of the $388 resistant zone, coupled with the RSI at 61, a bullish move to the $500 resistant is feasible and possibly $700 before the year runs out.
Similarly, failure to pull that stunt from NASDAQ:AVGO might resort to a move to the $250 support point.
With earnings slated for December 11th, 2025, In 2024, Broadcom's revenue was $51.57 billion, an increase of 43.99% compared to the previous year's $35.82 billion. Earnings were $5.90 billion, a decrease of -58.14%.
Analyst Summary
According to 28 analysts, the average rating for AVGO stock is "Strong Buy." The 12-month stock price target is $353.86, which is a decrease of -6.38% from the latest price.
About AVGO
Broadcom Inc. designs, develops, and supplies various semiconductor devices and infrastructure software solutions worldwide. The company operates in two segments, Semiconductor Solutions and Infrastructure Software. It provides Ethernet switching and routing custom silicon solutions, optical and copper physical layer devices, and fiber optic transmitter and receiver components; set-top box system-on-chips (SoCs), data over cable service interface specifications cable modem and networking infrastructure.