Bullish Points in HUBCHUBC Analysis
Closed at 219.38 (21-07-2026)
Positive Points:
> Bullish Divergence
> Bullish Bat Pattern
Current Range (214 - 219) seems to be a Good Support Zone.
Potential to move upside towards 224 - 226 initially.
It should not break 210.
On a bigger tf, it is also making Bullish Flag Pattern.
Bullish Bat
AMTX: Bullish Bat Pattern Signals a Potential ReversalAMTX has reached a key Potential Reversal Zone (PRZ) between $1.45 and $1.50, where a Bullish Bat Harmonic Pattern has completed. After an extended decline, this area could mark the beginning of a trend reversal if buyers step in and confirm the move.
Trade Setup
Potential Reversal Zone: $1.45–$1.50
Entry: Wait for a bullish confirmation above $1.50, or consider scaling into a position within the PRZ.
Stop Loss: Below $1.25.
Profit Targets: $2.50, $3.50, $5.00, $10.00, and $14.50.
The setup offers a favorable risk-to-reward profile, but confirmation remains important. A strong bullish candle or increased buying volume from the PRZ would add confidence to the trade, while a break below $1.25 would invalidate the pattern.
With clearly defined risk and multiple upside targets, AMTX is a chart worth keeping on your watchlist over the coming sessions.
Ethereum's Bullish Bat Pattern Near CompletionEthereum's daily chart is forming a Bullish Bat Harmonic Pattern, with price now trading inside a key Potential Reversal Zone (PRZ). This area represents the completion of the pattern and coincides with a strong historical support level, making it a critical zone to watch for a bullish reversal.
A confirmed breakout from the descending trendline could shift momentum in favor of buyers, opening the door to upside targets at $2,800, $3,850, $5,000, and potentially $7,200 if the pattern fully plays out.
As with all harmonic setups, confirmation is essential. A sustained break below the PRZ would invalidate the pattern, while a strong bullish reaction could mark the beginning of Ethereum's next major upward move.
Bullish Patterns Showing Signs of Reversal!BERG Analysis
Closed at 92.32 (18-05-2026)
Bullish Bat Pattern + Bullish Divergence; Both are signs of reversal.
Also ABCD chart pattern touched its Point D (PRZ) in Golden Pocket Range.
So if this time 80 is not broken, we may witness upside towards 97 - 100 &
then around 110 - 111.
Bullish Bat Pattern in PAXGUSDTPAXGUSDT Analysis
CMP 4562.97(19-05-2026 02:59am PST)
Bullish Bat Pattern along with Bullish
Divergence showing signs of reversal.
However, 4488 is an Important Support.
Upside resistance is around 4800 - 4900 initially.
Crossing & Sustaining this range may lead it towards
5200 - 5300.
The Bullish Setup on ETH Has More Potential Than Once ThoughtFollowing up on this initial Bullish idea on the 4 Hour:
and this Bullish idea on the daily:
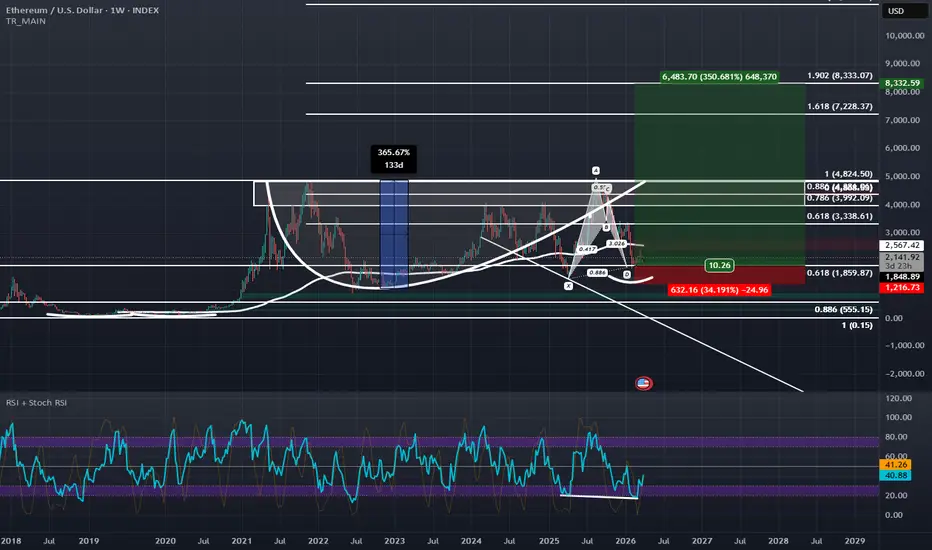
It would seem that ETH also has a big bullish setup on the weekly as seen in the current chart. We are at the all-time 0.618 Retrace and at this retrace we are making a local 0.886 and completing a Bullish Bat visible on the Weekly with Hidden Bullish Divergence on the RSI. If ETH really starts to bounce here at this heavy level of confluence it would be confirming a Partial-Decline of a Right-angled and Descending Broadening Formation, (a pattern of which that seems to be serving a secondary purpose of being the potential handle of a bigger Cup with Handle Pattern). If this starts to trade back towards 5000, chances of a Breakout are increased due to the partial decline, and the measured move of the Cup with handle and the Right-angled and Descending Broadening Formation both would take ETH to the 1.618-1.902 Fibonacci extension zones between $7,000, and $8,500.
It's also worth noting that ETHBTC on higher timeframes has also completed a Bullish Bat pattern and if you inflation adjust ETH's current price using the older metrics of the M1 Money supply before the rule change in 2020, ETH's price right now would actually be around $770 in terms of 2018 dollar value which is pretty cheap. So I'd say now would be as good of chance as any for ETH to stage a bottoming rally and this rally would likely be in line with the bottoming fractal we see on BTC:
and the topping pattern we see on USDT Dominance:
LAES Bullish Bat with Three Rising Valleys ReversalPattern Identified: Bullish Bat with strong confluence at Potential Reversal Zone (PRZ).
Key Confluence:
Harmonic PRZ: D aligns with 0.886 XA extension
Price Action: Three rising valleys forming at PRZ - showing accumulation and higher low structure
Momentum: Bullish divergence present on MACD
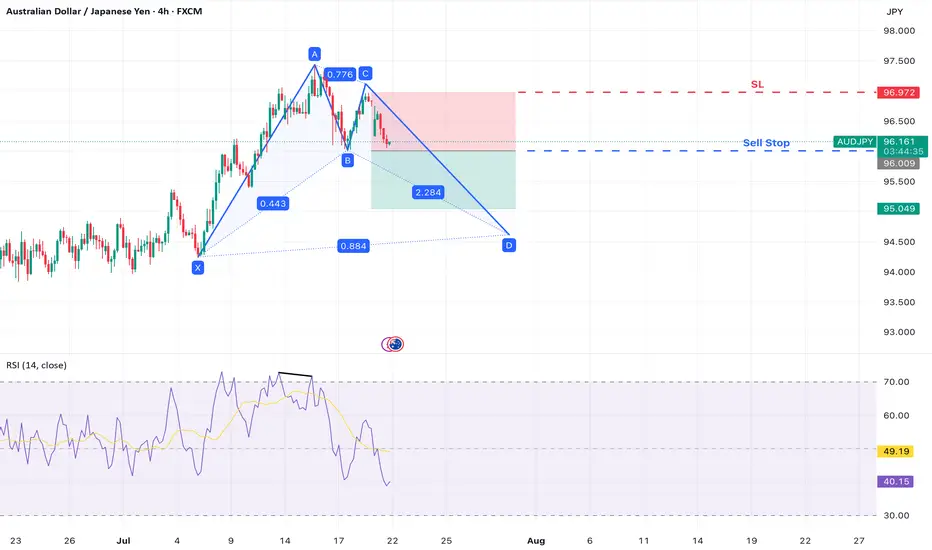
AUD/JPY – Bearish Move Within Bullish Bat StructureAUD/JPY is developing a Bullish Bat harmonic pattern on the 4-hour chart . While the full pattern has not yet completed, a potential short-term bearish opportunity is emerging as the pair begins forming the CD leg.
A clear b earish divergence on the RSI at Point A suggests waning bullish momentum, and a break below Point B may confirm the start of the final leg down toward Point D , completing the harmonic structure.
Trade Setup
Sell Stop Entry: 96.009 (break of Point B – confirms CD leg underway)
Stop Loss: 96.978 (above Point C – invalidates CD leg projection)
Take Profit 1: 95.040 (1:1 risk-to-reward level)
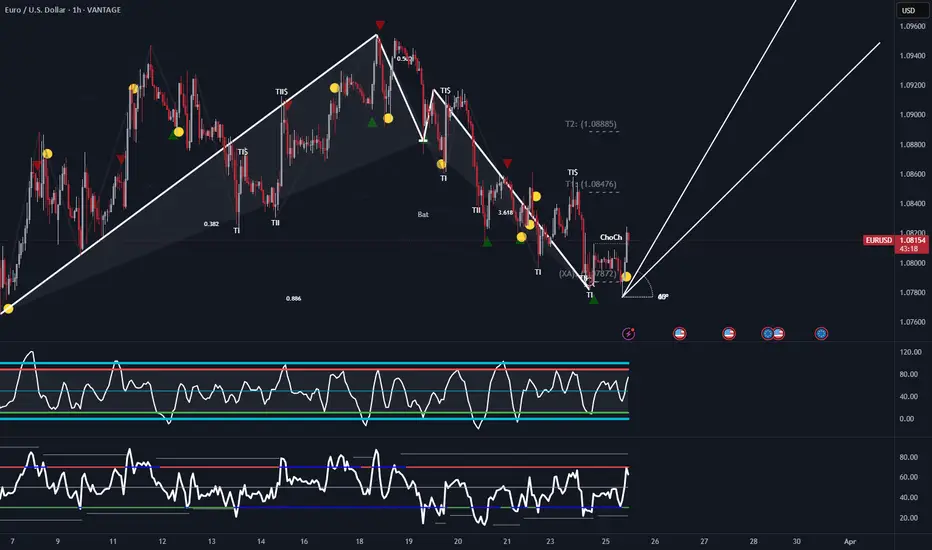
EUR/USD Technical Analysis – Potential Reversal SetupThe EUR/USD 1-hour chart displays a recent downtrend with a series of lower highs and lower lows, forming a bearish market structure. The Harmonic patterns such as the Bat suggest potential areas of reversal, aligning with Fibonacci retracement levels.
A Change of Character (ChoCh) at the latest low (XA 0.7872) signals a possible shift in trend. The presence of bullish reaction points, marked by green triangles and yellow circles, suggests buying pressure is increasing. Additionally, the projected upward trendlines indicate possible price targets at 1.08476 (T1) and 1.08885 (T2) .
The oscillators at the bottom indicate oversold conditions, reinforcing the likelihood of a bullish correction. However, confirmation via price action and volume is necessary before entering long positions. A break above key resistance levels would further validate the upside potential.
CAD/JPY: Potential Reversal as Buyers Step InCAD/JPY has shown signs of exhaustion in its bearish momentum after completing a deep Bat harmonic pattern. The pair has reached a key Fibonacci extension zone, where price action suggests a possible reversal.
Bullish interest is evident with price stabilising near the 105.50 level, supported by oversold conditions on momentum indicators. If buyers sustain pressure, a corrective move towards 106.50 and potentially 107.18 could unfold. Confirmation through a breakout of local resistance would further validate a bullish recovery scenario.
Price rengeBAT/USDT Chart:
Trend: Uptrend Price above moving average (yellow line).
Support: Green zone
Around 0.2317.
Resistance: Red zone Around 0.3778.
Possible Strategy:
Buy: Breaked EMA snd firs resistance
Sell: If price fails to break resistance
Note: Always consider market new and overall trends.
100,000$ per coin - BTC heading to 4th HalvingBITSTAMP:BTCUSD BINANCE:BTCUSD CME:BTC1! COINBASE:BTCUSD
What’s Bitcoin?
Bitcoin is a decentralized digital currency that operates on a network of computers, eliminating the need for intermediaries or central authorities. It was introduced in 2009 by an anonymous individual or group known as Satoshi Nakamoto, who outlined the concept in a white paper describing a peer-to-peer electronic cash system. Since then, Bitcoin has emerged as the leading and most valuable cryptocurrency globally, with a market capitalization exceeding $580 billion as of October 2023.
A notable characteristic of Bitcoin is its limited supply of 21 million coins, a threshold estimated to be reached around the year 2140. The creation of new bitcoins is regulated through a process called mining, which involves solving complex mathematical problems using specialized hardware and software. Miners compete to discover valid solutions that meet a specific difficulty level, adjusted approximately every two weeks to maintain an average block time of 10 minutes. The miner who successfully finds a valid solution for each block is rewarded with freshly minted bitcoins and transaction fees.
As of October 2023, the Bitcoin network has witnessed the mining of 813,378 blocks, with a current reward of 6.25 bitcoins per block.
Key Insights on Bitcoin's Price:
Recently, the mining of the 19.5 millionth bitcoin increased the circulating supply to 93% of the total. Additionally, a logarithmic regression analysis known as the rainbow chart illustrates the historical path of Bitcoin's price movement. This cyclic behaviour can be attributed to several factors:
Bitcoin tends to exhibit an overall bullish trend due to its limited supply and the halving of coins entering circulation approximately every four years. Historically, the Bitcoin halving has been a significant catalyst for price movements as it influences the supply-demand balance. The halving reduces the rate of new bitcoins being introduced into circulation while demand typically remains steady or grows over time. This creates a supply shock that often drives the price upward, particularly before and after the halving event.
Each halving period encompasses the mining of 210,000 blocks and exhibits distinct phases. The bullish phase spans from the first block to the 70,000th block, followed by a bearish phase from the 70,001st block to the 140,000th block, and finally a sideways phase from the 140,001st block to the 210,000th block. As previously mentioned, the halving diminishes the inflation rate of bitcoin and preserves its scarcity.
Bitcoin holds great influence over the entire cryptocurrency market due to its dominant market capitalization. This dominance follows a cyclical pattern, with the market share falling below 40% during bearish phases (after mining more than 140,000 blocks) and rising to around 70% during bullish phases.
During each era (between two halving periods), Bitcoin experiences an average drawdown of 80%.
Current Analysis:
We are currently in the third halving era, which commenced on May 11th, 2020, specifically within the equilibrium phase. The intersection of the mining of the 210,000th block and the lows of the logarithmic regression suggests a value of $30,000 USD per bitcoin.
The next Bitcoin halving is expected to take place in April 2024, at block number 840,000. This event will reduce the block reward from 6.25 bitcoins to 3.125 bitcoins, consequently lowering the annual inflation rate from approximately 1.8% to 0.9%. As a halving typically ushers in a bullish phase, it is predicted that the price of bitcoin will surpass $100,000.00 during this era.
Technical Analysis Using the MVRV Indicator:
One of the tools that can help investors and traders assess the value and potential of bitcoin is the MVRV ratio, which stands for market value to realized value. The MVRV ratio compares the current market capitalization of bitcoin (the total value of all coins at their current price) with its realized capitalization (the total value of all coins at their last moved price). The MVRV ratio can indicate whether bitcoin is overvalued or undervalued relative to its historical average cost basis.
The MVRV ratio can also be used to identify periods of extreme market sentiment, such as euphoria or panic. When the MVRV ratio is very high (above 4), it means that bitcoin is trading far above its realized value, implying that most holders are sitting on large unrealized profits and may be tempted to sell. This can signal a market top or a bubble territory. When the MVRV ratio is very low (below 1), it means that bitcoin is trading far below its realized value, implying that most holders are sitting on large unrealized losses and may be reluctant to sell. This can signal a market bottom or a buying opportunity.
As of October 2023, the MVRV ratio of bitcoin is about 2.110, which is slightly above its long-term average of 2. This suggests that bitcoin is fairly valued and not in a danger zone. The MVRV ratio has been trending up since November 9th 2022, when it reached a low of 0.75, indicating a recovery in the market sentiment and the lowest price of the 3rd Halving era. As we are far from the overbought level of 4, this suggests that there is still room for further growth in the price of bitcoin.
(These illustrations are just for educational purposes and are not financial advices).
Sources:
1. trustwallet.com
2. ieeexplore.ieee.org
3. nber.org
4. buybitcoinworldwide.com
5. bitinfocharts.com
6. nerdwallet.com
7. investopedia.com
8. buybitcoinworldwide.com
9. kitco.com
10. coinwarz.com
11. datawallet.com
12. blockchain.com
13. lookintobitcoin.com
14. bing.com
15. bitcoinmagazine.com
16. stopsaving.com
17. decentrader.com
18. trustwallet.com
19. bitinfocharts.com
20. nber.org
21. buybitcoinworldwide.com
22. cryptonews.com
23. finbold.com
24. inferse.com
25. buybitcoinworldwide.com
26. blockchain.com
EURJPY Bullish Bat pattern: Forecasting an Upside moveHello traders,
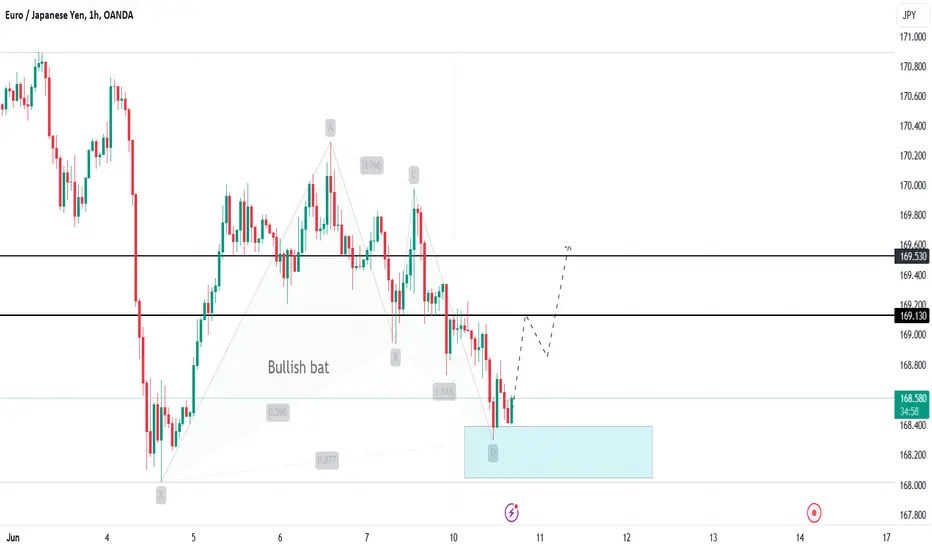
A number of harmonic patterns are surfacing today. Here is my analysis of a clear bullish Bat pattern spotted on the EURJPY Pair. The Bullish Bat pattern is a harmonic pattern used in technical analysis to predict potential reversal zones. The EURJPY pair has formed this pattern with the following parameters:
X = 168.022
A = 170.293
B = 168.940
C = 169.976
D = 168.302
Here's the breakdown of the Fibonacci relationships for this pattern:
AB Leg: Retraces 38.2% to 50% of the XA leg. Point B at 168.940 confirms this.
BC Leg: Retraces 38.2% to 88.6% of the AB leg. Point C at 169.976 confirms this.
CD Leg: Extends 161.8% to 261.8% of the BC leg or retraces 88.6% of the XA leg. Point D at 168.302 confirms this and is close to the 88.6% retracement of the XA leg.
In summary, the points X, A, B, C, and D fit within the Fibonacci retracement and extension levels for a Bullish Bat pattern on EURJPY. This indicates a high probability of a bullish reversal at point D (168.302), which also qualifies as a good support zone for price.
In addition, my Elliott Wave analysis suggests the pair has completed the corrective wave ABC to the downside. I'm anticipating an impulsive move to the upside towards 169.70 and 170.31. Let's watch out for confirming price action.
Cheers and happy trading.
NVDA may form a bat harmonic within a pennant.NASDAQ:NVDA is potentially forming a bullish bat variation of the Gartley harmonic, within a pennant on the four-hour chart. As long as the earnings low at point B is maintained, there is potential for a reversal to point C next week, corresponding to the upper trendline from all-time highs.
USD/CHF Bullish Setup: Harmonic Pattern & RSI Divergence AlignedThe USD/CHF pair is currently exhibiting a Bullish Bat Harmonic Pattern on the daily chart, which is aligned with a key support area. This setup suggests potential bullish momentum in the coming sessions, supported by multiple technical indicators.
Harmonic Pattern Analysis:
The Bullish Bat Harmonic Pattern is identified, signaling a potential reversal from the current downtrend. The pattern aligns perfectly with a significant support zone, increasing the probability of a bullish reversal. This convergence of harmonic patterns and key support areas often leads to a high-probability trade setup.
Key Support and Rejection:
The price has shown a strong rejection at the key support level of 0.85115, further solidifying the bullish outlook. The rejection at this level suggests that buyers are stepping in, preventing the price from falling further. This support level has historically acted as a pivotal zone for USD/CHF, adding credibility to the current bullish scenario.
Bullish RSI Divergence:
Adding further confluence to our bullish sentiment is the Bullish RSI Divergence observed on the daily timeframe. As price made lower lows, the RSI indicator formed higher lows, indicating a potential reversal in the trend. This divergence reinforces the likelihood of an upward movement in the USD/CHF pair.
Trade Setup:
Entry: 0.85115
Stop Loss: 0.83985
Take Profit Levels:
TP-1: 0.86245
TP-2: 0.87375
TP-3: 0.88505
Conclusion:
The confluence of the Bullish Bat Harmonic Pattern, key support level, and Bullish RSI Divergence provides a compelling case for entering a long position on USD/CHF. The outlined trade setup offers a favorable risk-to-reward ratio, with clear levels to manage the trade effectively. Traders should monitor price action around the entry point to confirm the bullish momentum before executing the trade.
Disclaimer: This analysis is for informational purposes only and should not be considered financial advice. Trading in the forex market involves significant risk, and it is essential to conduct your own analysis before making any trading decisions.
Bullish Bat Breakout: EURNZD Trade IdeaHello traders, I hope you're all doing well. Below is my analysis of the EURNZD pair and a detailed plan on how I intend to capitalize on this trading opportunity.
1. Pattern : Bullish Bat on EURNZD.
2. Completion : The pattern reaches completion at point D, which is approximately at 1.81178 on the chart.
3. PRZ Zone : The potential reversal zone for considering long positions, in anticipation of a bullish reversal, spans about 100 pips, ranging from 1.8185 to 1.80758.
4. Target Levels : Post-reversal, the targeted levels are T1 at 1.83131, T2 at 1.84192, T3 at 1.84952, and the extended target T4 at 1.86495.
5. Entry : I am looking to confirm a breakout above the 1.81849 price region upward, with solid market support for going long before entering the trade.
6. Invalidation : Should there be a break and a close below 1.80758, this would invalidate the pattern and the associated trade idea.
This idea is potentially a 4RR trade idea if it goes as planned.
I will appreciate your thoughts on this idea.
Note: This is not a financial advice.
Cheers and happy trading!
USDJPY Analysis: Opportunities for Shorting EnthusiastsUSDJPY is still pretty bullish, but for those looking to short, here's what I'm watching:
Daily Chart:
- Signal : Retest of the broken trendline
- Entry : Wait for MCC
1-Hourly Chart :
- Bearish Deep Gartley Pattern at 157.33
- Conservative Entry : Wait for MCC, preferably a retest on the PRZ (Potential Reversal Zone) with RSI Divergence
What's your trade plan for USDJPY? Comment down below and share your thoughts!
Happy trading!
AUDUSD Trade Setup: Harmonic BandsA lot of traders aren't familiar with Harmonic Bands ; to be fair, they don't appear frequently.
Here's what I'm looking at:
AUDUSD H4 Chart:
- Short Entry: 0.6666
- Long Entry: 0.6600
Target on the opposite end.
What's your trade plan for AUDUSD? Share your thoughts and strategies in the comments below!
Happy trading!
Understanding Bearish and Bullish Bat Harmonic Patterns
Understanding Bearish and Bullish Bat Harmonic Patterns: A Professional Guide for Traders
In the dynamic world of trading, identifying potential reversal points is crucial for making informed decisions. Two powerful tools that professional traders often rely on are the Bearish and Bullish Bat Harmonic Patterns. These patterns, grounded in Fibonacci ratios, offer insights into market behavior and help in predicting price movements. This article delves into the intricacies of these patterns, providing a comprehensive guide for traders.
__________________The Bearish Bat Harmonic Pattern_________________________
The Bearish Bat Harmonic Pattern is a reversal pattern that indicates a potential decline in price after an upward correction. Here's how to identify and interpret this pattern:
X-A Leg: The initial move where the price falls from point X to point A.
A-B Leg: The price then retraces upwards from point A to point B, typically reaching 38.2% to 50% of the X-A leg.
B-C Leg: The price falls again from point B to point C, retracing 38.2% to 88.6% of the A-B leg.
C-D Leg: The final leg sees the price rise from point C to point D. Point D is the critical point, expected at the 88.6% retracement level of the X-A leg and coinciding with the 161.8% extension of the B-C leg.
Key Fibonacci Ratios:
A-B: 38.2% to 50% retracement of X-A
B-C: 38.2% to 88.6% retracement of A-B
C-D: 88.6% retracement of X-A and 161.8% extension of B-C
Trading Strategy: Traders should look for selling opportunities around point D, anticipating a downward move following the completion of the pattern.
Entry, Stop-Loss (SL), and Take-Profit (TP) Criteria:
Entry: Enter a short position at or near point D.
Stop-Loss (SL): Place the stop-loss slightly above point X to account for any potential false breakouts.
Take-Profit (TP): Set the first TP at the 61.8% retracement of the C-D leg and the second TP at the 100% retracement of the C-D leg.
_________________________The Bullish Bat Harmonic Pattern_____________________
Conversely, the Bullish Bat Harmonic Pattern signals a potential rise in price after a downward correction. Here are the steps to identify and utilize this pattern:
X-A Leg: The initial move where the price rises from point X to point A.
A-B Leg: The price then retraces downwards from point A to point B, typically reaching 38.2% to 50% of the X-A leg.
B-C Leg: The price rises again from point B to point C, retracing 38.2% to 88.6% of the A-B leg.
C-D Leg: The final leg sees the price fall from point C to point D. Point D is the critical point, expected at the 88.6% retracement level of the X-A leg and coinciding with the 161.8% extension of the B-C leg.
Key Fibonacci Ratios:
A-B: 38.2% to 50% retracement of X-A
B-C: 38.2% to 88.6% retracement of A-B
C-D: 88.6% retracement of X-A and 161.8% extension of B-C
Trading Strategy: Traders should look for buying opportunities around point D, anticipating an upward move following the completion of the pattern.
Entry, Stop-Loss (SL), and Take-Profit (TP) Criteria:
Entry: Enter a long position at or near point D.
Stop-Loss (SL): Place the stop-loss slightly below point X to account for any potential false breakouts.
Take-Profit (TP): Set the first TP at the 61.8% retracement of the C-D leg and the second TP at the 100% retracement of the C-D leg.
______________________Practical Application and Tips_______________________
To effectively utilize these patterns, traders should:
Use Confirmation Indicators: Always combine harmonic patterns with other technical indicators, such as RSI or MACD, to confirm potential reversal points.
Practice Patience: Wait for the pattern to fully develop and reach point D before taking action.
Risk Management: Implement strict risk management strategies, including stop-loss orders, to protect against potential false signals.
Conclusion:
The Bearish and Bullish Bat Harmonic Patterns are powerful tools in a trader's arsenal, providing a structured approach to identifying potential market reversals. By understanding and applying these patterns, traders can enhance their decision-making process and improve their trading performance. Remember, like all technical analysis tools, these patterns are most effective when used in conjunction with other indicators and sound risk management practices. Happy trading!