The Bullish and Bearish Cases For ETH/USDOverview:
This idea contains both bullish and bearish cases for ETH/USD.
Bullish Case:
ETH/USD has formed a bullish pennant since April 8th. A strong break above the pennant's upper line indicates further upward momentum. The probability of success for a bullish pennant is roughly 54%.
Bullish Case Warning:
Although the bullish pennant is formed, there is a chance the price breaks below its bottom line, which would invalidate it. The bullish pennant is also accompanied by bearish RSI divergence, making a break of the bottom line more likely.
Bearish Case
Since December 17th, 2024, ETH/USD has formed a bearish butterfly harmonic pattern. The probability of success for a harmonic butterfly is roughly 75%. In addition to the butterfly, ETH/USD has short-term bearish divergence, further supporting point D as a turning point downward.
If the butterfly plays out, I would expect an initial drop to the 0.618 Fibonacci around $2750.
Bearish Case Warning
Given that there is a bullish pennant on the short term, I would wait until it is invalidated before taking a short position.
Butterfly
ONEUSDT 30M small step towards reversalHarmony (ONE) is once again reminding traders that even modest altcoins can surprise with sudden moves.
After days of sideways action the price finally found support around 0.0098–0.0099 and is now attempting a breakout. The chart shows a wedge compression, EMAs aligning, and the volume profile confirming a buyer’s zone. If the price secures above 0.0102 the door opens towards 0.0107 as the first solid target.
Fundamentally it’s not the star of the show but with crypto market momentum ticking up ONE could easily catch the wave. Right now it looks like a student before the exam: everything is learned, just needs to answer out loud.
Along with ONE I’m also adding TURBOUSDT, ADAUSDT and XRP (Ripple) to my buy block — they’re setting up for similar bounce opportunities.
BNBUSD ShortIt appears Binance Coin buyers are losing momentum, as the butterfly golden level at $868 seems to be fading in appeal.
The market's energy might soon take a pause—perhaps even a longer rest.
Will this downturn be a minor setback or a deeper slump ?
Stay tuned for the unfolding crypto drama!
GBPAUD – Bearish Momentum in PlayFollowing the liquidity sweep observed on August 20th, I’m looking for a potential sell on GBPAUD. The bearish setup aligns with a successfully confirmed daily Harmonic Butterfly pattern, adding confluence to the short bias.
Key Levels:
Entry: 2.09 /2.10
Take Profit 1: 2.0700 – 2.0680
Take Profit 2: 2.0400
Stop Loss: 2.1040
This setup combines price action and harmonic structure, suggesting a high-probability scenario for further downside. I’ll be monitoring lower timeframes for confirmation before executing the trade.
NOT A FINANCIAL ADVICE
GOLD SHORT TRADE VIEWAronnoFX will not accept any liability for loss or damage as a result of
reliance on the information contained within this channel including
data, quotes, charts and buy/sell signals.
If you like this idea, do not forget to support with a like and follow.
Traders, if you like this idea or have your own opinion, please feel free command me.
The End of BTC correction? BTC analysis 2/8/2025In my point of view, BTC has completed its correction and is now ready for a strong upward move, potentially targeting the $137,000–$139,000 range, based on the following factors:
1. Confirmation of the Butterfly Harmonic Pattern
The recent reversal occurred within the expected range of the Butterfly harmonic pattern. Typically, the XD leg in a Butterfly harmonic extends to 1.27, but in practice, this can stretch up to 1.414, which is commonly used as a flexible stop-loss zone. After testing the 1.27–1.414 range, a clear 5-wave impulse followed—testing a key trendline and making an attempt to break above the recent high. This sequence, followed by a corrective move, suggests that the broader correction may be complete.
2. Complex WXYXZ Correction Structure
In my previous analysis, I underestimated the duration and depth of the correction. The wave (4) (blue), which is part of the wave (iii), has taken considerable time—likely to allow wave (5) to extend sufficiently to break above the $130,000 level. This would support the assumption that wave (5) (purple) is the extended wave. The overall corrective structure appears highly complex, and can be counted as a W–X–Y–X–Z pattern, supported by the presence of multiple internal corrections within the wave components.
3. 0.618 Fibonacci Retracement of Wave (3)
Wave (4) has now reached the 0.618 Fibonacci retracement level of wave (3), which is significant. Historically, BTC’s corrections rarely retrace beyond the 0.87 level. This deep retracement suggests wave (4) is likely complete—unless price were to fall below that threshold, which would invalidate this assumption.
RANGING OIL PRICE HEADING FOR RESISTANCE.Price has been stuck in consolidation mode
Currently heading for resistance levels where we expect a decline
Backed-up by a bearish harmonic pattern
and a bear flag clearly visible on the 4HR time interval
BShort
IGBPAUD | 3H Chart | Precision Setup –
🦋 Bullish Harmonic Activation – Deep Zone Precision
When elegance meets geometry — we trade like a Monaco man.
🔺 Pattern: Potential Bullish Bat/Alt Bat
XA → AB → BC → CD
Ideal D-point completion at 2.0462
88.6% XA retracement + 2.0+ BC extension = high-probability reaction zone
🛡️ Demand Zone:
Price is testing the PRZ (Potential Reversal Zone) at 2.0462
Reaction expected → projected targets:
🎯 TP1: 2.0616
🎯 TP2: 2.0674
⚙️ Entry Plan:
Long from 2.0462–2.0465
Invalidation below structure low
Maintain composure. Let the setup mature — precision > prediction
💡 Bias: Tactical long within channel, targeting liquidity above C
🎩
MAJOR MONTHLY SUPPLY ZONE ON GBP/JPY SELLERS INBOUNDRegarding the monthly supply zone, my technical analysis indicates that the price has historically failed to breach this area over several years. I anticipate a potential reversal and recommend waiting for confirmation, such as a double top or harmonic pattern, before initiating a sell position. Furthermore, i will consider selling opportunities upon the .618 Fibonacci level being reached.
Entry: 199.0
Take Profit: 183.3
Overall Price Target: 163.0
ADIB - same $comi patternADX:ADIB timeframe 1 hour
Is showing a triangle pattern with a potential bearish trend. It is currently testing the upper line of the triangle. The stop loss is at 23.00, and the target sell point ranges from 26.22 to 27.60.
This is not investment advice, only my analysis based on the chart data. Consult your account manager before making any investment decisions. Good luck.
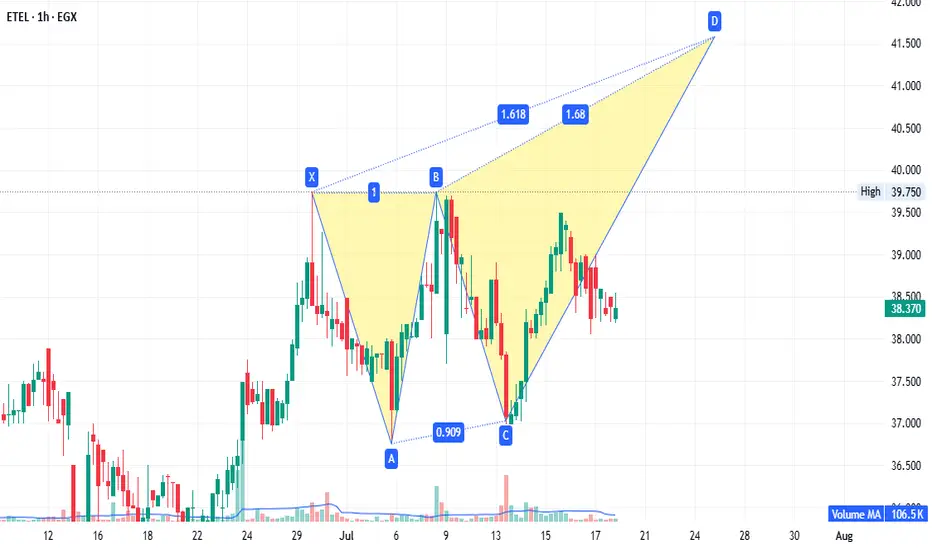
ETEL - strong fundamentals.EGX:ETEL 1-hour timeframe:
A potential bearish Gartley pattern targets 41.50. If prices reach 41.55 (without breaking 37.00), it becomes a sell point with targets at 39.73 and 38.60. Conversely, if prices continue rising and close above 42.70, rebuy what was sold at 41.50, targeting 52.00. This setup is both strategic and supported by strong fundamentals.
Disclaimer: This is not financial advice, only our analysis based on chart data. Consult your account manager before investing.
GOLD SHORT TRADEAronnoFX will not accept any liability for loss or damage as a result of
reliance on the information contained within this channel including
data, quotes, charts and buy/sell signals.
If you like this idea, do not forget to support with a like and follow.
Traders, if you like this idea or have your own opinion, please feel free command me.
TRG LongTRG has made a perfect bullish harmonic pattern where it has retraced to exact 127.2% of its last top and now will move till 161.8% of its all-time high which is nearly 295. This is not a buy/sell call, its just my own analysis and you may disagree. However, I'd urge you to study bullish and bearish harmonic patterns which are not so common in Pakistani market but some international players often run a stock through this pattern. Similar patterns can be noticed in GHNI and GAL as well.
EURUSD ||| '' W '' PATTERN IDENTIFIED . ✅ Harmonic Formation (Bearish Potential)
⚠️ Selling Bias forming soon
---
🧩 Pattern Breakdown:
A Bearish Harmonic Pattern (likely Butterfly or Deep Crab) has been identified and is now nearing completion at the D point.
Current price is approaching key resistance / reversal zone, precisely around the 0.786 - 0.886 fib area (highlighted red).
The Risk-to-Reward is clearly mapped:
🔺 Stop Loss: 1.19405
✅ Entry Zone: Around 1.17106
🎯 Target: 1.09588
Potential short setup if price respects the harmonic symmetry and fails to break above resistance.


