Visa (V): 30% Upside SetupVisa (V) has been in a strong secular uptrend for over a decade, and the recent weakness over the past year represents a corrective phase largely driven by macro headwinds, namely higher interest rates, valuation compression across large‑cap quality stocks, and a broader market rotation rather than any deterioration in Visa’s underlying business. Technically, price has now completed a clean ABCD (1:1) measured move to the downside, signaling the maturity of the pullback, and is trading into a key confluence zone: prior resistance now acting as support, the rising long‑term trendline, and the 0.382 Fibonacci retracement. This area typically attracts higher‑timeframe buyers, and while a minor sweep lower to retest structure support is possible, the overall setup suggests downside is limited. Historically, Visa’s pullbacks tend to recover to prior highs within a few months, and given the extended nature of this correction, a recovery over roughly six months is reasonable, implying potential upside of ~30%. This technical setup is strongly supported by fundamentals: Visa is a dominant global payments network with ~50% profit margins, powerful network effects, inflation‑hedged revenues, manageable debt, ongoing share buybacks, and durable cash flows, making this pullback a high‑probability mean‑reversion opportunity within a long‑term uptrend.  Long
Long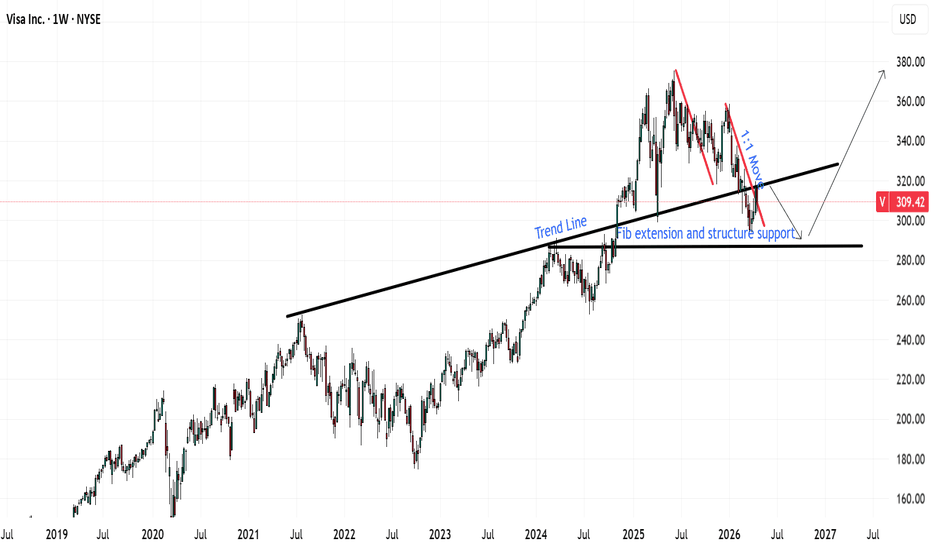
 Long
Long
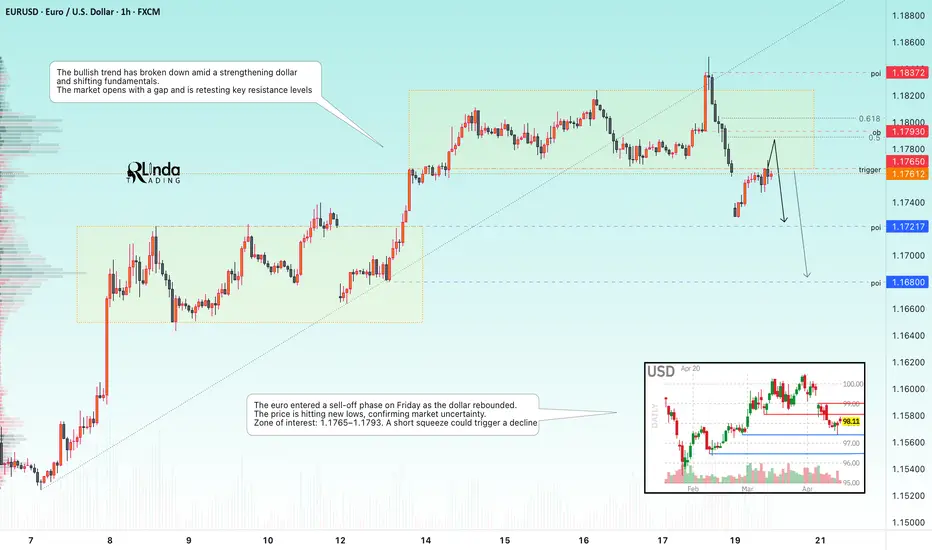
GOLD - Geopolitics and two scenarios... Gold, under downward pressure, is testing the 4,668 support level. However, technical factors are weak against the backdrop of fundamental and geopolitical developments. Iran may resume negotiations...
Gold remains under pressure due to a combination of strong U.S. data and geopolitical uncertainty, which is driving investors toward the dollar rather than gold. However, the second round of peace talks between the US and Iran is expected to begin today. If the talks take place, combined with positive signals, this could push gold higher.
I know how much you dislike two scenarios, but under current circumstances, we need to be prepared for anything.
Two triggers: 4711 (4715) — consolidation above this zone could confirm the end of the correction and trigger a move toward 4800–4880.
And support at 4670...
Resistance levels: 4711–4715, 4795
Support levels: 4668, 4644, 4600
However, a negative outcome of the negotiations and an escalation of the conflict could increase pressure on gold due to a potential rise in oil prices. In that case, the market may break through 4670 and head toward 4600. Stay tuned for updates!
Best regards, R. Linda!  Long
Long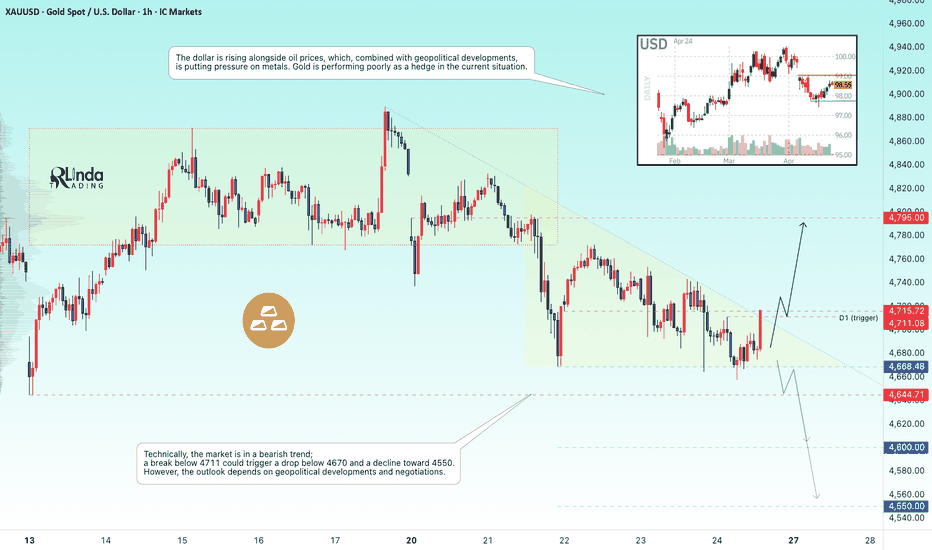
Short 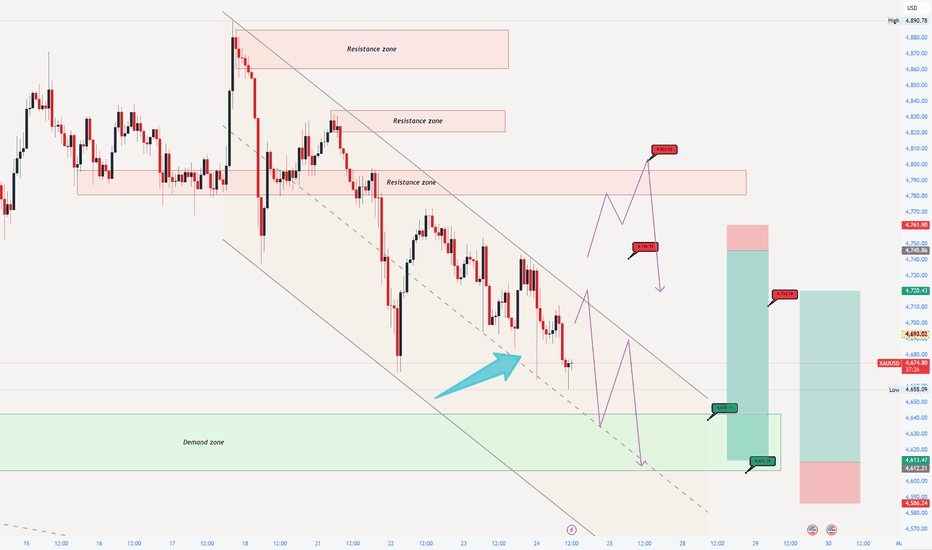
XAUUSD – “A deceptive calm” before the next move After the sharp drop, gold is no longer falling… but it’s not recovering either. Price is currently “trapped” within the H2 range of 4693 – 4754. On the surface, it looks like harmless sideways action, but in reality this is a liquidity build-up phase before the next move.
From a macro perspective, the story isn’t supportive:
The FED remains committed to high interest rates to fight inflation, while US–Iran tensions continue to simmer. As a result, capital is favoring USD over gold, keeping downside pressure intact.
I’m not trying to predict the market — just reacting to it.
If price pulls back into 4723 – 4730 → 475X → 477X → 4800, I’ll look for SELL opportunities in line with the downtrend.
If price breaks below 4690, I’ll execute a Sell Stop (SL 4702), targeting 4680 → 4660 → 4640.
The main trend remains bearish. Sideways is only temporary.
For those who are active, you can scalp within the 4693 – 4754 range, but stay quick in and out.
👉 If you’re watching this setup too, drop a 🚀 and share your view. Follow for updates when the market reveals its next move. Short 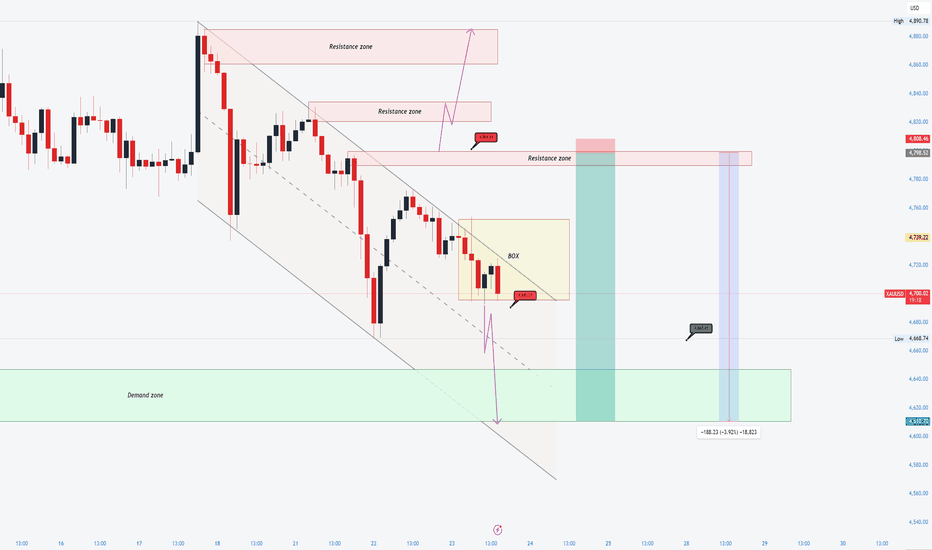
GOLD - A pullback before an upward Gold is forming a long lower wick at a key support zone and is recovering from yesterday’s drop. The move up from the local low has reached around 2.5%. Before continuing the rally, a pullback toward 4738 is possible as traders hunt for liquidity.
Trump’s unilateral extension of the ceasefire has given temporary relief to the dollar and supported gold. However, negotiations remain stalled. Iran is waiting for a “comprehensive proposal” from the US, while port blockades are still in place.
Escalation threats (which usually pressure gold) remain. Meanwhile, the Fed: Kevin Warsh hinted during testimony that he may be less dovish than previously expected.
De-escalation, successful London talks (including reopening of key routes), and a weaker dollar could support further upside in gold. On the other hand, failed negotiations, renewed escalation, a stronger dollar, and rising rate expectations could put pressure on the metal.
Resistance levels: 4772, 4798, 4830
Support levels: 4738, 4700, 4668
Before moving higher, gold may test the 4738–4720 liquidity zone. However, a breakout and consolidation above 4770 could trigger an early rally.
Also keep an eye on statements from countries involved in the Middle East conflict, as the market may react unpredictably to any sharp developments.
Regards : KING OF GOLD Long 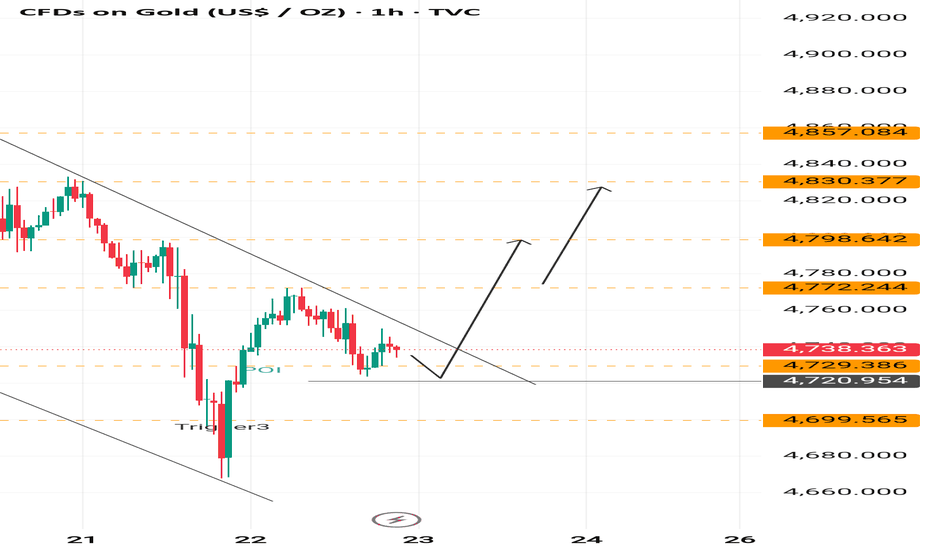
GOLD - A pullback before an upward move FX:XAUUSD is forming a long squeeze at a key support zone and recovering from yesterday’s decline. The rise from the local low amounted to 2.5%. Before the rally continues, a pullback to 4738 is possible as traders seek liquidity.
Trump unilaterally extended the ceasefire, giving the dollar a temporary respite and supporting gold. However, negotiations have stalled; Iran is waiting for a “comprehensive proposal” from the U.S., and the port blockades remain in place.
Threats of escalation (gold reacts negatively to such developments)
Fed: Kevin Warsh signaled during testimony that he may be less “dovish” than previously expected.
De-escalation, the success of London talks on reopening the Strait, and dollar weakness could support further gold gains. However, a breakdown in negotiations, escalation, a strengthening dollar, and expectations of a Fed rate hike will increase pressure on the metal...
Resistance levels: 4772, 4798, 4830
Support levels: 4738, 4700, 4668
Before rising, gold may test the liquidity zone of 4738–4720. However, a breakout and consolidation above 4770 could trigger a premature rally.
It is also worth monitoring statements from countries involved in the Middle East conflict; the market may react unpredictably to any sharp statements.
Best regards, R. Linda! Long 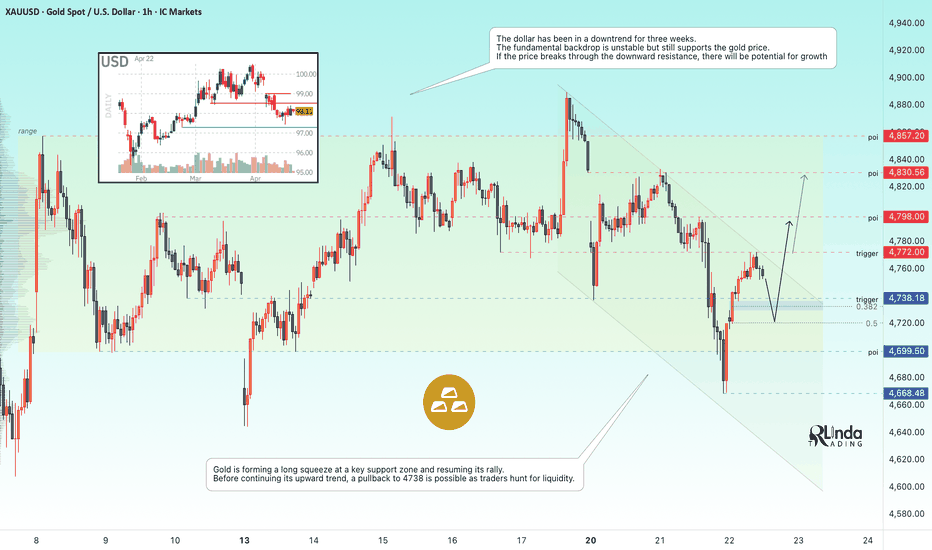
 Short
Short
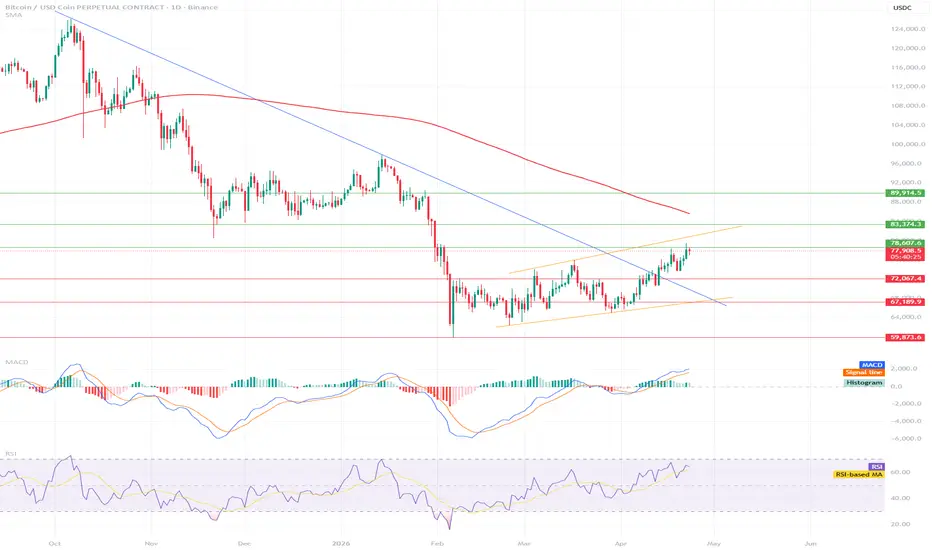
BITCOIN - The bulls may prove themselves...BINANCE:BTCUSDT.P is showing signs of a bullish trend on a local scale. The asset has been forming a bullish trend since April. Focus on the key resistance level of 76,000
Bitcoin is forming a medium-term uptrend that began in early April. The price will continue to test the resistance zone of 76,000–76,300
A local bullish structure is forming, within which Bitcoin is attempting to break through the 76K resistance level. If the bulls maintain control of this area, we will see potential for growth toward 78K–80K
Resistance levels: 76,000, 76,300, 78,000
Support levels: 74,560, 73,700
A shallow pullback followed by another breakout attempt is a fairly strong bullish signal. Confirmation of the breakout will be local consolidation above the key resistance zone, which could trigger further growth toward 78K–80K.
Best Regards, R. Linda!  Long
Long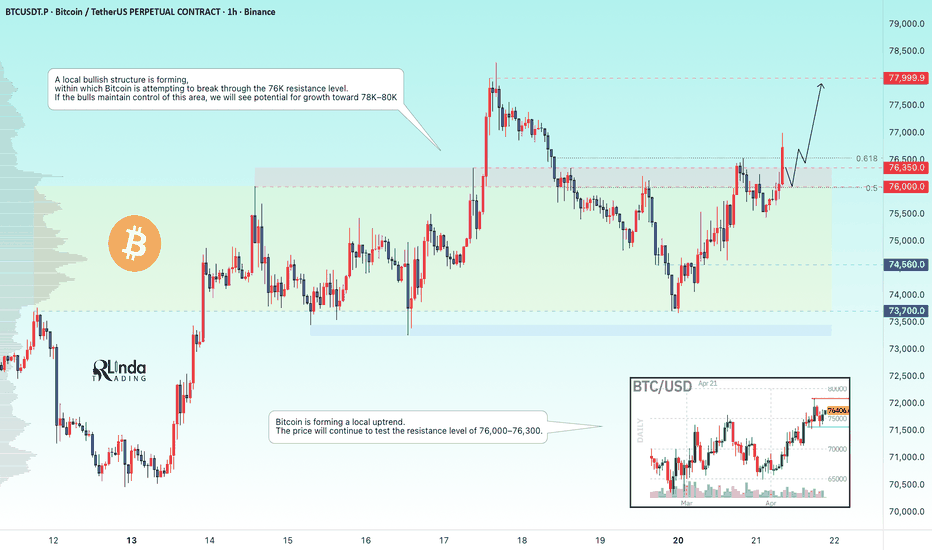
GOLD - The market didn't trust Friday's positive newsICMARKETS:XAUUSD reacted positively to the de-escalation of the conflict in the Middle East on Friday; however, a couple of hours later, the market lost faith in the news and resumed selling...
Iran closed the Strait of Hormuz in response to the breakdown of the ceasefire in Lebanon. The geopolitical backdrop is deteriorating. The market may react aggressively to any escalation: the dollar and oil up, gold down.
Direct peace talks with the U.S. have been suspended until Washington changes its “maximalist” demands, according to Iran’s Foreign Ministry.
Technically, the chart also suggests that the market did not believe Friday’s news and does not expect a favorable outcome or price growth in the near future.
The dollar is rebounding, while gold is forming a short squeeze at resistance.
Resistance levels: 4837, 4857
Support levels: 4785, 4729, 4700
After a false breakout, gold is closing below the local support level of 4837. A retest of 4837–4857 could trigger a sell-off and a decline toward the 4785 area of interest. A close below 4785 could intensify the sell-off toward 4730–4700.
Best regards, R. Linda! Short 
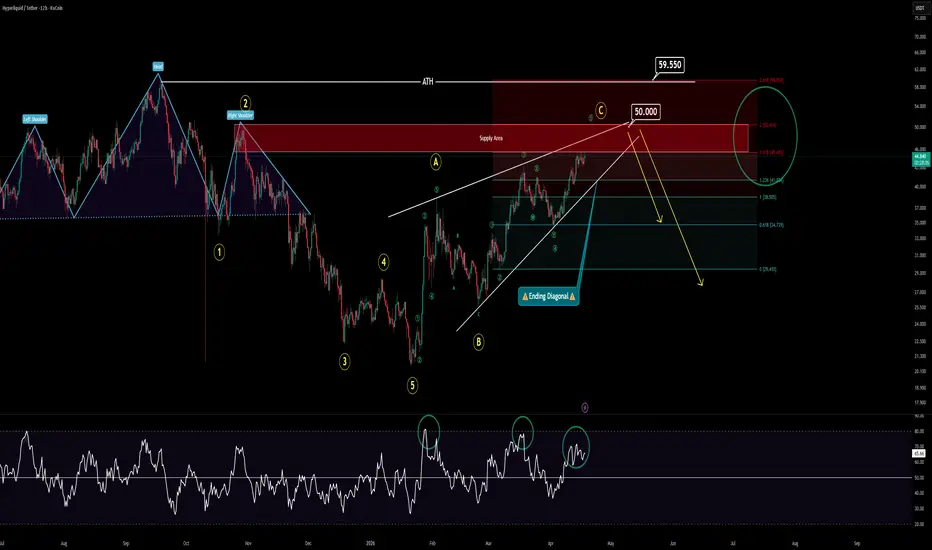
HYPE is in DangerHype is currently apporaching a hardcore supply zone but that's not all.
Rally was strong until the last day before it touches the main Supply Zone.
At the moment, if you check any indicator that can show you divergence like RSI, you'll realise that price is struggling to climb any higher.
Moreover, check the Volume as always you should :
As you can see easily, volume is also showing weekness and divergence.
This is also signaling something else and also the my main point:
"Ending Diagonal"
This is how it looks like:
This is not just a "nice pattern" to memorise, it's the ultimate signal of a falling knife.
To understand wave counting better, you should always check the previous waves in order to understand the current one.
In the previous waves, there was 5 wave impulsive down trend and it already finished many weeks ago.
The current wave counting shows we're in a corrective wave in higher time frames which can be labeled as A-B-C. Assuming the current wave C is on going, the inner waves has shown on the chart. The current inner wave count shows us that the price is in inner wave 5. That also can be proven by volume divergence at current zone.
If we add near supply zone into this calculation, we can easily see where this is going.
Or at least, it should be going.
I'd look for short positions in the red supply zone on the chart. If price can close above $50 on weekly chart, I'll make an update. Any wick that goes beyond $50 is a liquidity hunt.
 Short
Short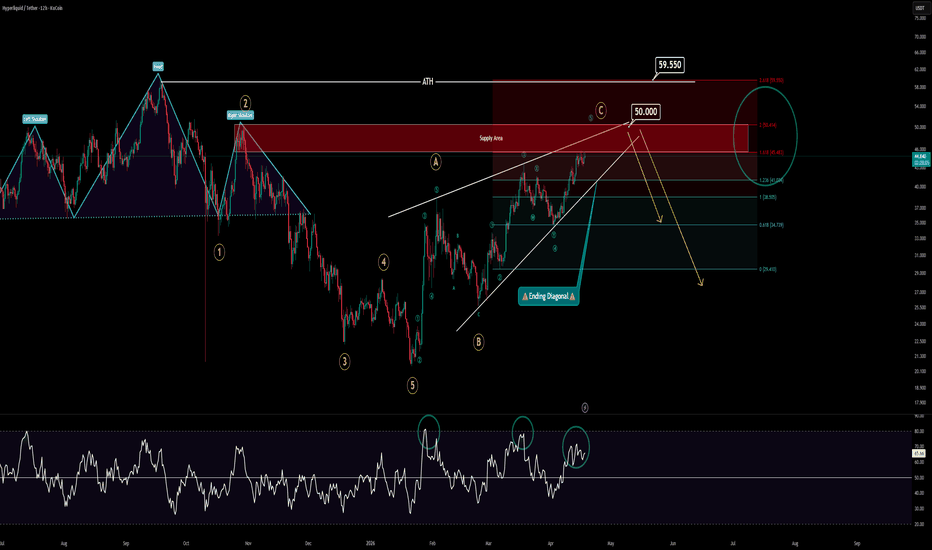
BTC/USDT 4H Chart Review🔎 Context (4H BTCUSDC)
Trend: Upward (ascending channel)
Current price: ~75k
There was a strong impulse to ~77.7k, then a quick drop → classic reaction to resistance
📈 What I see on the chart
1. Upward channel
Price respects a nice channel
Currently, we are in the middle of the channel → no advantage
👉 This is a "no trade" zone for the patient
2. Key levels
🟢 Resistance:
77,700 – 78,000
79,700 – 80,000 (HTF resistance)
👉 There was aggressive selling here → strong supply
🔴 Support:
74,200 (local support)
71,400 (strong level / breakout of the structure earlier)
3. Price structure
Higher lows ✔️
Higher highs ✔️
BUT:
Last move = rejection + downward impulse
👉 Possible short-term pullback / correction
4. Oscillators
Stoch RSI is moving down → downward momentum
CHOP: no extreme trend → possible consolidation
🧠 Scenarios
🟢 LONG SCENARIO (more trend-based)
Conditions:
Defense at 74,200
Reaction to the lower channel line
Targets:
77,700
80,000
👉 Ideal entry: lower channel band + support
🔴 SHORT SCENARIO (countertrend / correction)
Conditions:
Loss at 74,200
Closing Below
Targets:
71,400
up to ~69k (if panic)
👉 This will be a liquidity flush after the rally COLPAL – Momentum surge into resistance or pause ahead ?📊 Colgate-Palmolive (India) Ltd – STWP Equity Snapshot
Ticker: NSE: COLPAL
Sector: FMCG / Consumer Staples
CMP: 2106 ▲ (+6.50%)
Learning Rating: ⭐⭐⭐⭐☆ (Momentum Expansion Near Key Supply Zone)
Chart Pattern Observed: Range Break Attempt with Strong Upside Momentum
Candlestick Context: Strong Bullish Expansion with Follow-Through
Colgate has shown a strong upward expansion after a phase of steady accumulation, pushing price toward a critical resistance cluster near the prior swing high. The structure reflects a shift from range-bound behavior into a momentum-driven move, supported by strong bullish candles and follow-through buying. The recent rally has brought price into the 2100–2120 region, which aligns with a prior swing high and supply zone. This makes the current zone a decision phase, where continuation depends on acceptance above resistance rather than just price expansion.
From a structural perspective, price is also trading within the Fibonacci golden zone (2040–2103), which typically acts as a high-probability reaction area. Sustaining above this zone strengthens the bullish case, while rejection may lead to consolidation. From a momentum standpoint, RSI is positioned near 64.4, indicating strong bullish strength without entering extreme territory. This supports continuation potential, provided resistance is absorbed. Volume participation has expanded sharply, with relative volume near 5 times the average. This reflects strong institutional activity and adds credibility to the current move.
Volume Analysis
Volume has surged significantly during the recent bullish expansion, confirming strong participation. This supports the strength of the move. Continued volume expansion above resistance will be key for trend continuation, while declining volume may result in consolidation near current levels.
Key Levels – Daily Timeframe
Primary support is positioned near 2009, followed by deeper structural zones near 1913 and 1856. These levels act as important demand areas and are critical for maintaining the bullish structure. On the upside, immediate resistance lies near 2162, followed by higher supply zones around 2218 and 2315. These zones represent prior reaction levels where selling pressure may emerge.
Structure Read – What Matters Now
The key observation is that price has moved sharply into a resistance cluster after a strong momentum expansion. If price sustains above the 2120–2160 zone, it may open the path toward higher resistance levels. If price fails to hold above current levels, a pullback toward the 2000–1950 support zone becomes likely. The structure currently reflects strong momentum but is entering a reaction zone where confirmation is required.
Price Reference Framework – Educational View
From an intraday perspective, the observation zone lies around 2121, with risk invalidation below 1965. Upside reaction zones are positioned near 2277 and 2433. From a swing perspective over the next two to five sessions, the observation zone remains near 2121, while structural invalidation lies below 1747. If momentum sustains, higher reference zones extend toward 2870 and 3431.
Pullback Observation Zone (Important)
Since the move is a sharp momentum expansion into resistance, chasing strength carries risk.
A more structured observation approach:
• 2040 – 2000 zone → First healthy pullback (golden zone support)
• 1980 – 1940 zone → Strong demand + value re-entry zone
• Below 1900 → Structure weakens, deeper consolidation possible
If price consolidates above 2100 instead of correcting sharply, it reflects strength and increases the probability of continuation.
STWP View
Momentum is strong and the trend is upward, supported by volume expansion and structure shift. Risk remains high due to proximity to resistance. Volume is high, supporting the move, and sentiment remains bullish but slightly stretched.
Final Outlook - Momentum: Strong | Trend: Up | Risk: High | Volume: High
Learning Note: When price enters a prior swing high zone with strong momentum, it becomes a decision phase. Breakouts are confirmed by acceptance above resistance, not by the move into it.
STWP Option Chain Analysis
Here is a quick options-based observation for COLPAL.
From the current options activity, a strong support base is visible near the 2000 zone, while resistance is positioned around 2200, forming a defined positioning band.
A key observation is the concentration of liquidity around the 2100 level, which is acting as a control zone where price may consolidate or rotate.
On the call side, aggressive writing is visible near 2200, indicating overhead supply. On the put side, liquidity near 2000 suggests strong support, reinforcing the lower boundary.
The positioning band currently appears between 2000 and 2200, creating a range width of approximately 200 points. Based on this structure, the expected movement range is around ±70–100 points from the ATM zone.
This places the approximate upside activity zone near 2180–2260, while the downside activity zone appears near 2020–1940.
From a positioning perspective, a long build-up is visible near the 2100 region, indicating bullish exposure. However, the presence of a strong call wall at 2200 suggests that continuation will require acceptance above this level.
Institutional Build-Up Signal
Build-Up Signal: Long Build-up
Key Liquidity Strikes
Best CE Liquidity Strike: 2200
Best PE Liquidity Strike: 2000
Liquidity Vacuum Observation
Liquidity Vacuum: No major vacuum detected
Current positioning suggests that price may rotate within the 2000–2200 band, with 2100 acting as a key control level.
If price sustains above 2220, it may indicate strengthening bullish momentum. On the other hand, a move below 1980 may increase downside pressure.
Overall, the current options structure reflects a controlled range with bullish undertones, where continuation depends on acceptance above resistance.
⚠️Disclaimer:
This analysis is generated strictly for educational and analytical purposes only.
All option structures, metrics, scores, interpretations, PCR, Max Pain levels, and volatility commentary are model-based observations derived from uploaded data. This does NOT constitute investment advice, trading advice, or a recommendation to buy or sell any security or derivative instrument. Options trading involves substantial risk and may not be suitable for all participants. Readers are advised to exercise independent judgment and consult a SEBI-registered financial advisor before taking any trading or investment decisions. STWP assumes no responsibility for any financial loss arising from the use of this analysis.
💬Did this help you read the chart better?
🔼 Boost | ✍️ Comment | 🔁 Share with a learner
👉 Follow STWP for clean chart-reading insights
Stay Calm. Stay Clean. Trade With Patience.
– STWP
 Long
Long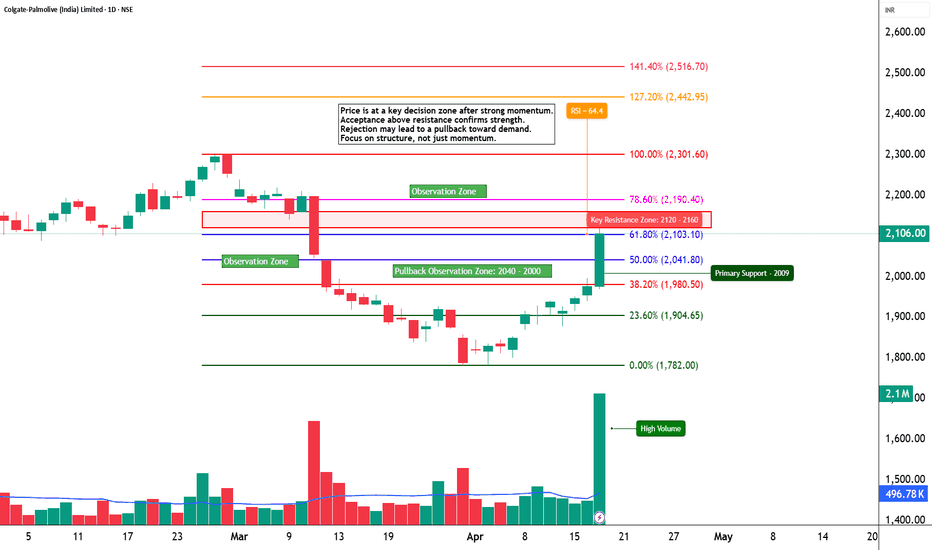
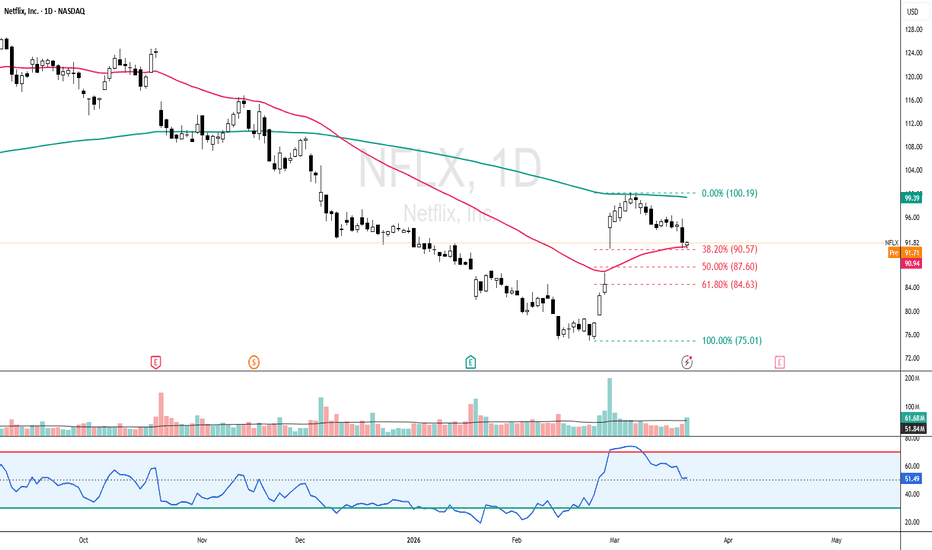
NETFLIX - Buy The Dip: Confluence Support HoldingNFLX - CURRENT PRICE : 91.82
Netflix is showing a constructive pullback into a confluence support zone, where price is retracing toward the EMA 50 while simultaneously testing the gap-up demand area. The retracement is also holding near the Fibonacci 38.2% golden ratio, which typically acts as a healthy correction within a developing rebound structure. This combination suggests selling pressure is fading and buyers are stepping in at higher levels, increasing the probability of a continuation move.
Momentum-wise, RSI has cooled from overbought levels and is stabilizing above midline, indicating pullback rather than trend breakdown. As long as price holds above the support cluster, the structure remains bullish for a move higher.
Technical Levels
Buy on weakness / near current zone
Target 1: 99 USD (EMA 200 test) 🎯
Target 2: 108 USD (next resistance zone) 🚀
Support / Invalidation: 86 USD
Risk-Reward: Attractive, with limited downside to 86 vs upside toward 99–108
Overall, the pullback into EMA50 + gap support + 38.2% Fibonacci creates a high-probability technical buy setup, favoring a rebound toward the EMA200 first, followed by a continuation to 108 if momentum builds.  Long
Long