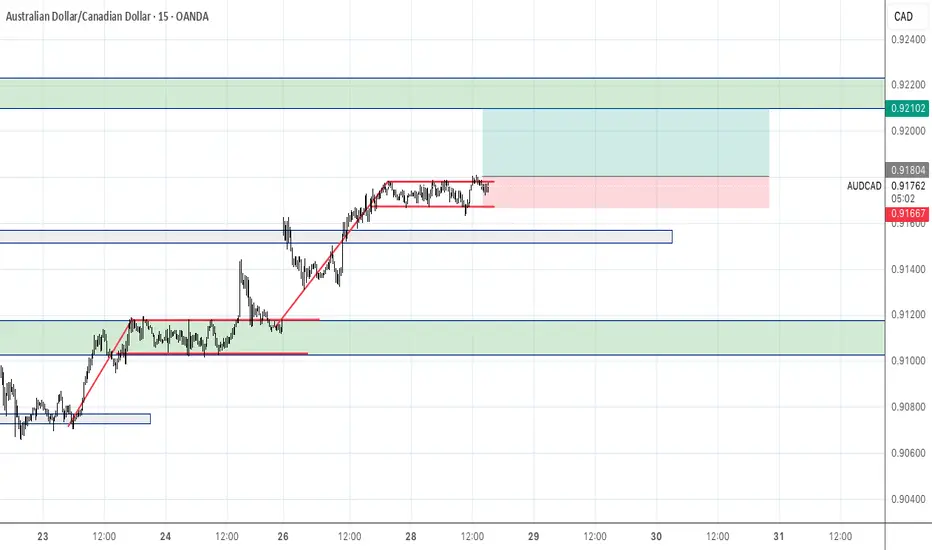
AAPL | Money will Rotate into this MEGA CAP | LONGApple, Inc. engages in the design, manufacture, and sale of smartphones, personal computers, tablets, wearables and accessories, and other varieties of related services. It operates through the following geographical segments: Americas, Europe, Greater China, Japan, and Rest of Asia Pacific. The Americas segment includes North and South America. The Europe segment consists of European countries, as well as India, the Middle East, and Africa. The Greater China segment comprises China, Hong Kong,
Flag
OPEN 1D - Flag Ready for Takeoff?On the daily chart, Opendoor Technologies (OPEN) is forming a clean bullish flag - a consolidation phase following a massive +400% rally since spring 2025. Price action remains tightly contained within the pattern, with strong support from the MA50 and the 6.3–7.4 buy zone, aligning with the 0.618 Fibonacci retracement.
Technically , the setup looks mature: MA50 is trending upward, MA200 sits far below, and volume contraction hints at a breakout ahead. The first target sits at $16.50 (1.618 ex
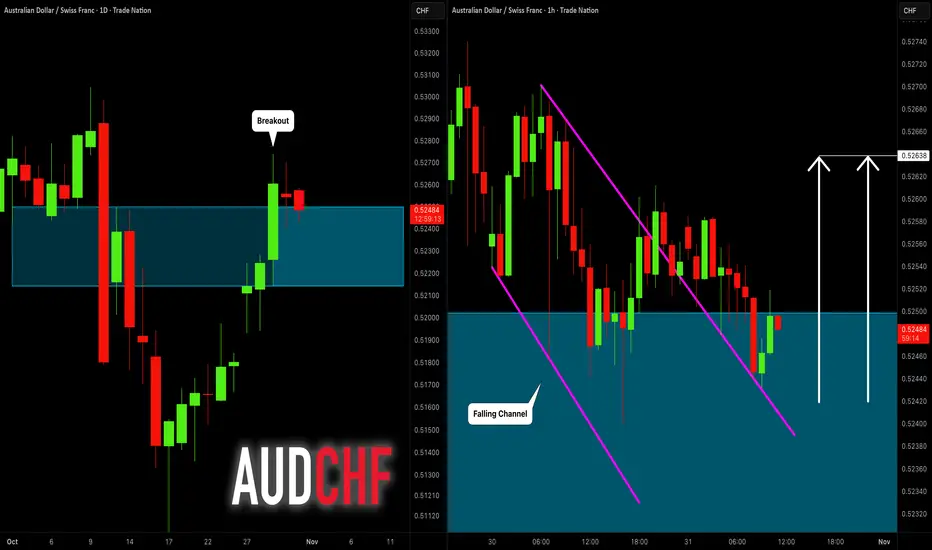
AUDCHF: Intraday Bullish Signal 🇦🇺🇨🇭
Quick update for AUDCHF.
Earlier, we spotted a confirmed breakout of a key
daily horizontal resistance.
Retesting the broken structure, the price successfully
violated a resistance line of a falling parallel channel on an hourly time frame.
It suggests a strong buying interest.
We can expect a move up now at least to 0.5264
❤️Please, support my work with like, thank you!❤️
I am part of Trade Nation's Influencer program and receive a monthly fee for using their TradingView charts in my
DOLLAR INDEX (DXY): Confirmed Bullish ContinuationThe DOLLAR INDEX appears to be showing bullish tendencies from both daily and intraday perspectives.
From a daily timeframe, I observe a confirmed breakout of a resistance line within a symmetrical triangle pattern, indicating a trend violation and continuation.
On an hourly timeframe, we see a breakout of a resistance line of a bullish flag pattern, followed by a strong bullish movement.
I anticipate that the market will continue to grow.
The next resistance level is identified at 99.53.
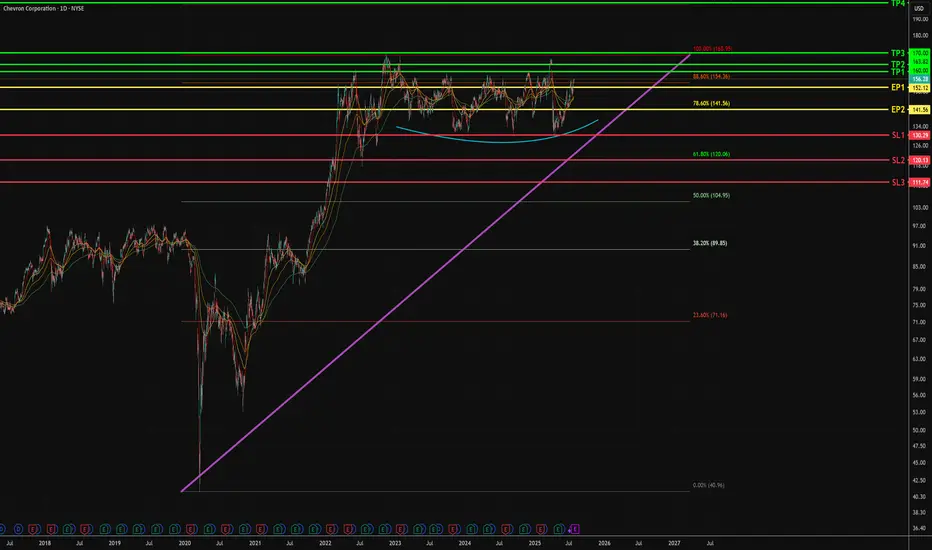
CVX - Potential Swing Upside - Mid TermTimeline - now to 3 months
1. Bullish flag pattern sustained, form during Oct 2021.
2. Rounding bottom above 1D resistance at $130
- Last close is above Fib 88.6% - $154.36
- In the 2 days, weak selling pressure is noticed.
3. More attempts to break 88.6% Fib level opposed to $130 support line
- Bullish angle upthrust stays above 45 degrees
- Concludes high change of breaking 88.6% fib level, towards previous high of $169.66
3. Entry points
EP 1 - buy spot with 1 or 0.5 size
EP 2 - Ent
STATE BANK OF INDIA.....Buy There are two reasons to buy 1.its broken out of a flag pattern...so Hence I calculated the first leg of the flag and arrived at the tgt mentioned on the chart...2.Another reason to buy is simple...Its hit blue skies ..meaning new unchartered territory..So buy with day close stoploss below the previous two days bars..
Momentum Building for a Break Above 183This month is about to close with a Bullish Engulfing candle. On the weekly timeframe, a clear W pattern has formed, supported by a bullish RSI divergence, strengthening the bullish outlook. The daily timeframe also reflects a W pattern, and price action is now shaping a pole and flag pattern near the neckline of the previous formation. With major resistance around 183, a decisive breakout above this level could trigger a bullish move toward 210.
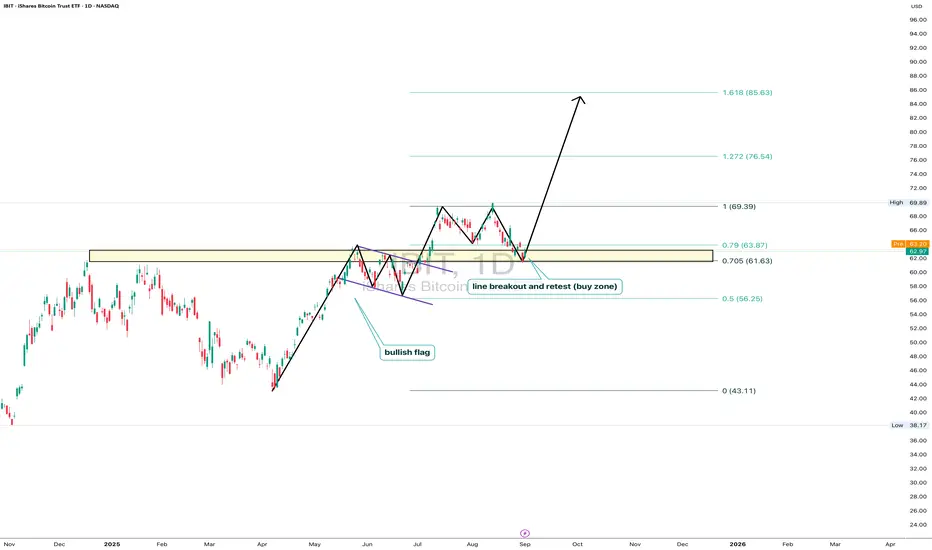
IBIT: ready for liftoffOn the daily chart, iShares Bitcoin Trust (IBIT) trades at $62.97, testing the key 0.705–0.79 Fibo zone ($61.63–63.87). This area marks a breakout and retest line, forming a clear buy zone. The technical structure remains bullish: after breaking out and pulling back, price holds potential to move toward $69.39, with Fibo extensions targeting $76.54 and $85.63. Volumes confirm buyer activity on dips, and the bullish flag pattern supports the continuation of the upward trend.
Fundamentally , t
Pole n Flag pattern break out, getting ready for upside.This stock has given break out of pole n flag pattern on weekly and daily timeframe. Volumes are also supporting chart and candle patterns. Stock is moving within range, any close above 800 on daily timeframe, can test higher side of the range I.e. 845.
Coca-Cola (KO) | Post-Earnings Technical SetupCoca-Cola just delivered a strong Q3 2025 — solid EPS/revenue beat, expanding margins, and resilient pricing power. But now, let’s talk technicals.
After months of compression, KO has broken out of the descending flag channel that’s been in formation since April 2025. The breakout came with a gap-up move following earnings — a signal of strength, but also a potential gap-fill zone to watch if momentum cools.
Price is currently testing the key $70–$71 resistance area , where prior supply
DOW JONES INDEX (US30): Bullish Continuation Confirmed
US30 index violated a major horizontal resistance yesterday.
The price started a correctional movement then, steadily
falling within a bullish flag pattern.
A breakout of its resistance line is a strong bullish signal.
Odds will be high, the index will hit 46900 level soon.
❤️Please, support my work with like, thank you!❤️
I am part of Trade Nation's Influencer program and receive a monthly fee for using their TradingView charts in my analysis.
NZDUSD: Time to Fall! 🇳🇿🇺🇸
NZDUSD may drop lower significantly, following a confirmed breakout
of a support line of a symmetrical triangle pattern.
With a high probability, the price will reach 0.569 level soon.
❤️Please, support my work with like, thank you!❤️
I am part of Trade Nation's Influencer program and receive a monthly fee for using their TradingView charts in my analysis.
ETHUSD Forming Bull Flag, Targeting $4,981 on BreakoutETH is forming a bull flag i.e. the uptrend is likely to resume
Execution
Wait for the breakout, enter if price decisively breaks above the upper flag trendline around $4,150. Avoid buying inside the flag
Take Profit
The pattern projects a target near $4,981
This is calculated by measuring the ~$800 "flagpole" rally and adding it to the breakout
Risk Mitigation
Place a stop loss just below $4,100 If price falls into the flag, the trade is invalidated
AMD clearing a daily tight flag right after a weekly C&HAfter Clearing a Weekly Cup with Handle, AMD is now clearing a tight flag on the daily chart.
Key points at the time of writing.
✣ New bull market cycle running since June 2025
✣ Market Direction is Up 90%
✣ Stock Fundamentals are good with multi-month growth except in December 2024
✣ Recent Open AI deal acted as catalyst to clear recent Cup with Handle base.
✣ Strong Institutional Interest with 2091 Buyers vs 1451 sellers TTM and a ownership of 71%
✣ Stock recently reset it's base count.
✣ TT
XAUUSD📊 XAUUSD (GOLD) – 1H Timeframe Analysis
Structure Update:
A clear Double Top has formed near the recent highs, signaling potential exhaustion after 9 weeks of continuous bullish momentum.
Price is now consolidating within a Bearish Flag, suggesting a pause before possible continuation to the downside.
📉 Outlook:
Correction looks imminent as buying momentum weakens and sellers begin to show presence near resistance.
Watch for a bearish candle confirmation and breakdown below the flag’s lowe