XDC: ready for a breakout? key levels to watch aheadXDC Mainnet – ready to wake up with the next alt rotation? Lately the market has been buzzing again about enterprise chains and real‑world asset tokenization, and XDC keeps popping up in those headlines. While majors are chopping around, this little guy has quietly built a base on KuCoin, so I’m watching it closely.
On the 4H chart price is pressing the local resistance zone around 0.038 with RSI already in overbought, after a clean bounce from the green demand at 0.034–0.035. Horizontal volume shows the main battle exactly in that green area, so any dip back there is likely to attract buyers again. Overall structure looks like accumulation after a long bleed, so I’m leaning to the upside once this range is done.
My base plan: buy pullbacks into 0.036–0.035 with targets at 0.041 first and then 0.047–0.05 if momentum really kicks in ✅ I want to see shallow corrections and buyers stepping in quickly; if candles start closing below 0.034, I assume bulls lost it and I look toward 0.031 instead. I might be wrong, but right now bears up here look more like exit liquidity than real trend setters.
Investing
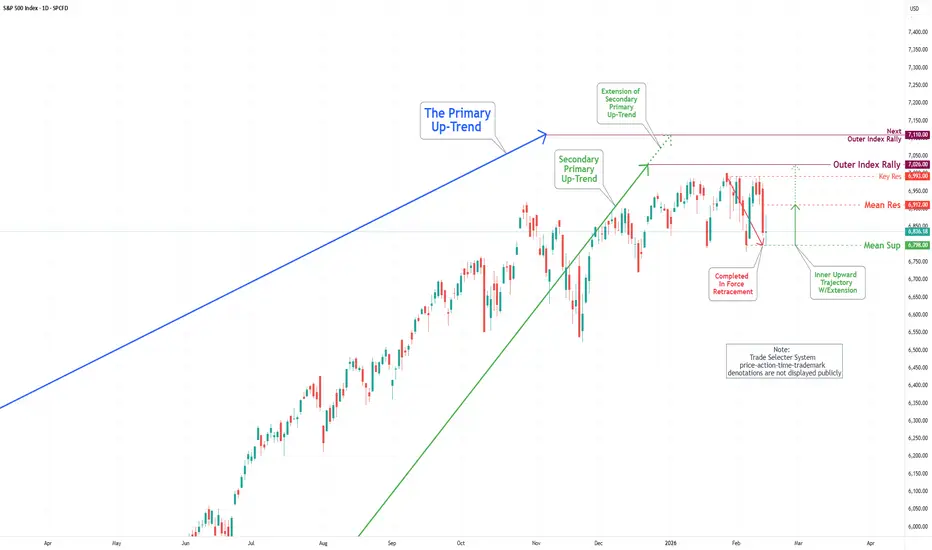
S&P 500 Daily Chart Analysis For Week of Feb 13, 2026Technical Analysis and Outlook:
The S&P500 Index exhibited an extraordinary rise and a sharp decline during the trading session this week, reflecting one of the most vigorous moves in recent trading activity. On the upside, it has met our target at Key Resistance 6,993 and has crashed sharply to Mean Support 6,798.
It is anticipated that the S&P500 Index will continue its upward trajectory toward the Mean Resistance at 6,912, with the ultimate goal of reaching our awaited outcome of an Outer Index Rally at 7,026.
Nevertheless, it is imperative to acknowledge that there is a substantial likelihood of a retracement retest that will lead to revisiting the Mean Support at 6,798 before the Index regains its bullish momentum.
EUR/USD Daily Chart Analysis For Week of Feb 13, 2026Technical Analysis and Outlook:
In the current trading session, the Euro has experienced a significant upward move, surpassing our Mean Resistance levels at 1.183 and 1.187.
It is anticipated that, following this development, the Euro has established an active Inner Trading Zone represented by Mean Support at 1.183 and Mean Resistance at 1.192.
Market participants are advised to remain vigilant for a currency downside bias, with a focus on the ultimate target of the Outer Currency Dip at 1.166.
Bitcoin(BTC/USD) Daily Chart Analysis For Week of Feb 13, 2026Technical Analysis and Outlook:
Bitcoin has seen moderate trading activity this week. The cryptocurrency
has established an active Inner Trading Zone enveloped between Mean Support 62,800 and Mean Resistance 71,200.
Current market analysis indicates a gradual fluctuation between these two markings before a breakout in either direction. Upon the upward movement, the target price is a Mean Resistance of 78,700, while the target for downward movement is an Outer Coin Dip at 60,000.
XAUUSD Stop Hunt Completed – Liquidity Sweep Before Major Move? The recent XAUUSD price action suggests a classic stop hunt and liquidity sweep scenario. Price briefly broke below a key support zone, triggering sell-side liquidity and stop-loss orders from retail traders, before sharply reversing back into the previous range.
This move appears less like a true bearish breakdown and more like a liquidity grab engineered to fuel a larger directional expansion.
📌 What Happened?
Equal Lows Formed – Price created a visible support area where retail traders placed buy entries and tight stop losses.
Liquidity Sweep – Smart money pushed price below those lows, triggering stops.
Aggressive Rejection – Strong buying pressure immediately absorbed the sell orders.
Reclaim of Structure – Price moved back above the broken support, signaling potential bullish intent.
This pattern often signals accumulation rather than continuation.
🧠 Why This Matters for Gold Traders
In the forex market, liquidity drives momentum. A stop hunt provides the fuel required for institutions to build positions before a significant move.
For Gold (XAUUSD), this setup typically leads to:
🔹 Short squeeze potential
🔹 Strong impulsive expansion
🔹 Market structure shift on lower timeframes
🔹 Break of short-term resistance
If price continues to hold above the reclaimed level, the probability increases for a bullish continuation toward higher resistance zones.
📊 Technical Confluence
Key confirmations to watch:
Higher low formation on 1H / 4H timeframe
Break of minor lower high (structure shift)
Increasing bullish volume
Rejection wicks below swept liquidity
Failure to hold above the reclaimed support would invalidate the bullish scenario and could lead to deeper downside continuation.
🎯 Trading Perspective
Instead of chasing the initial breakout, patient traders wait for:
Pullback into imbalance / fair value gap
Confirmation candle (bullish engulfing or strong momentum close)
Clear risk-to-reward structure
Risk management remains critical — liquidity sweeps can occur in both directions.
📈 Conclusion
The recent XAUUSD move shows characteristics of a stop hunt completion, suggesting smart money may have accumulated positions before a larger expansion.
If bullish structure confirms, Gold could be preparing for a significant upside move. However, traders should monitor key levels closely for confirmation rather than anticipating direction prematurely.
KuCoin Token (KCS): watching for support? key levels to trackKuCoin Token. Who’s still watching this after the regulatory drama and exchange outflows? Recently headlines about legal pressure on the platform dumped KCS hard, but the last few sessions the panic cooled and price started to grind sideways instead of falling straight down. That’s usually where smart money quietly reloads while everyone else is traumatized.
On the 4H chart we’ve got a classic post‑crash base: support holding around 7.9‑8.0 with shrinking sell volume and RSI climbing from oversold but still below 50. I’m leaning long: short sellers look tired, and any good news on the exchange side can spark a fast short squeeze. First serious liquidity sits near 8.3‑8.5, then higher up toward 8.8‑9.0 if momentum kicks in. I might be wrong, but I don’t see aggressive new supply here yet.
My plan: ✅ consider longs while price is above 7.9 with targets 8.3 then 8.8‑9.0, taking partials on the way. ⚠️ If 7.8 breaks and we close below, I’d flip the script and look for a washout toward 7.3‑7.0 instead of holding bags. I’m waiting for either a clean bounce from 8.0 or a stop‑hunt spike below it before jumping in.
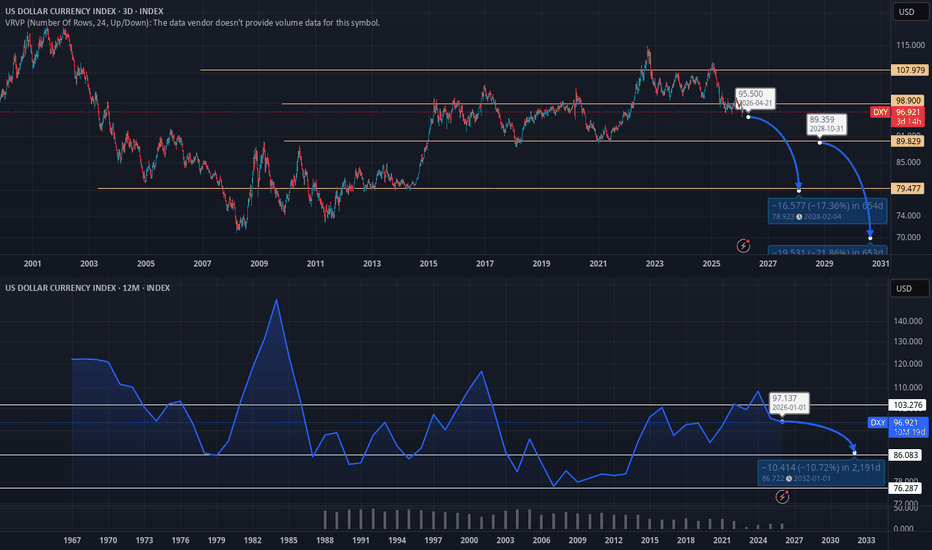
DXY Analysis (February 13, 2026): Technicals & Macro-Fundamental1. Technical Analysis: Levels and Structure
The DXY index is under pressure, testing critical support zones following the decline in 2025. We are approaching key levels that will trigger either a technical bounce or an accelerated drop.
Current Price: ~97.05 (Consolidation zone).
Trend: Descending (Medium-term Bearish).
Key Levels (Support & Resistance):
Resistance 1 (R1): 97.75 — Mirror level (former support). A break above is necessary for bulls to catch their breath.
Resistance 2 (R2): 98.70 — January 2026 highs.
Pivot (Trend Reversal): 100.20 — Only a close above this invalidates the global "bearish" scenario.
Support 1 (S1): 96.65–96.80 — Local "bottom". If this fails to hold, price drops lower.
Support 2 (S2): 96.00 — Psychological barrier.
Support 3 (S3): 94.50 — Next major target upon a breakdown of 96.00.
2. Fundamental Analysis: Macro Risks
A. Fed Rate & Inflation
The market expects rate cuts to ~3.25–3.50% by year-end. Monetary easing reduces US bond yields, making the dollar less attractive for carry trades compared to previous years.
B. US National Debt
Figures: US National Debt reached $38.56 trillion in February 2026 (up $2.35T YoY).
Impact on DXY: The massive debt load weighs on the dollar long-term. Investors fear "fiscal dominance," where the Fed is forced to print money or keep rates low to service debt. This is a classic currency devaluation scenario.
Forecast: The CBO (Congressional Budget Office) predicts debt will exceed 101% of GDP in 2026 and continue rising to record highs by 2030. This creates structural selling pressure for the USD.
C. De-dollarization Trend
CB Reserves: The dollar's share of global reserves continues to decline. From ~71% in 1999, it has fallen to ~56-57% by 2026.
Diversification: Central Banks (especially in Asia and BRICS) are actively buying Gold and other currencies, reducing reliance on US Treasuries. This is a long-term trend slowly but surely eroding DXY strength.
Nuance: Despite the drop in reserves, the dollar still dominates global payments (about 50% of all SWIFT transactions). The "death of the dollar" is exaggerated in the short term but evident in the long term.
3. Trading Conclusion (Action Plan)
For the Trader (Short-term):
Bias: Bearish, but cautious. We are sitting at support.
Scenario: Wait for a reaction at 96.65. If we break below — short to 96.00 and 94.50. If we bounce — long with a short target up to 97.75.
Risk: A sudden spike in bond yields (US10Y) could give the dollar a temporary boost.
For the Investor (Mid/Long-term):
The combination of rising national debt ($38.5T+) and declining reserve share suggests that any DXY rally should be viewed as an opportunity to exit into hard assets (BTC, Gold, Real Estate). Globally, the dollar is losing purchasing power.
WLD: potential breakout ahead? key levels to watch for todayWLD. Still watching this thing drip and wondering if the next move is finally up? AI coins are back on the radar after fresh headlines about new partnerships in the sector, while, according to the market, WLD is facing another wave of attention around supply and regulation. Volatility is waking up again right at a key support zone.
On the 4H chart price is sitting on a big demand block around 0.36–0.37, where we already saw a sharp wick and quick buyback. RSI bounced from oversold and is curling up near 40–50, hinting at a possible mean‑reversion push. With a fat volume node under price and several stacked resistance shelves above, I’m leaning toward a short‑term long bounce into 0.40–0.42, maybe 0.43–0.45 if momentum joins. I might be wrong, but this looks more like accumulation than a fresh breakdown.
My simple plan: ✅ bullish scenario is long from this green zone or on a 4H close above 0.38 with first take‑profit near 0.40–0.41, second around 0.43–0.45. Stop for me lives below 0.355, where this demand idea dies. ⚠️ If price closes below that area and holds, I flip the bias and expect a slide toward the next liquidity pocket closer to 0.33, so I’d rather step aside than bag‑hold.
TAO: ready for a bounce? key levels to watch this weekTAO. Tired of watching this AI darling bleed out every 4H candle? After a crazy run on the AI narrative, headlines now talk about profit taking and rotation into “safer” majors, and the chart shows exactly that mood: a controlled grind down with no real capitulation yet.
On the 4H chart price is sitting right on the local demand around 150, with RSI parked in the 30‑35 zone and starting to show a mild bullish divergence. Volume profile is empty below and thick above, so I’m leaning toward a relief pop rather than an immediate cliff. For me the key short term box is 150‑170 – lose it and sellers stay in full control.
My base plan: I’m stalking a bounce long from this demand, targeting the 175‑185 area first, maybe 200 if momentum finally wakes up ✅. If 150 breaks and holds below, I drop the long idea and expect a slide toward 140 and even 130, where the next real liquidity sits. I might be wrong, but right now fading panic here looks better to me than chasing the downside.
Oracle’s Cloud Ascent: Powering the Global AI RevolutionOracle has shed its legacy reputation. It now stands as a central pillar of the artificial intelligence era. Recent stock surges reflect a profound transformation in the company’s core identity. This evolution positions Oracle as a formidable challenger to established cloud giants.
The AI Infrastructure Pivot
Oracle Cloud Infrastructure (OCI) currently drives the company’s aggressive growth. A landmark partnership with OpenAI validates Oracle’s high-performance computing capabilities. OpenAI utilizes OCI’s massive GPU clusters to train next-generation models. This collaboration signals a shift in the industry hierarchy.
OCI offers a unique architectural advantage. It uses Remote Direct Memory Access (RDMA) networking. This technology allows GPUs to communicate with extreme efficiency. Consequently, Oracle provides faster training speeds than many competitors. Enterprises now view OCI as the premier destination for AI workloads.
Sovereign Clouds and Geostrategy
Geopolitics now dictates the future of data management. Nations increasingly demand data residency within their own borders. Oracle’s "Sovereign Cloud" strategy directly addresses these national security concerns. The company builds localized data centers for specific government entities.
This geostrategy provides Oracle with a significant competitive moat. It captures high-value contracts that require strict regulatory compliance. Oracle enables digital sovereignty for the European Union and beyond. By aligning technology with policy, Oracle secures long-term global revenue streams.
RDMA: The Science of Speed
Oracle’s success stems from deep scientific innovation in networking. Patent analysis reveals a strong focus on high-speed data interconnects. These patents protect the firm’s ability to scale AI clusters seamlessly. High-tech hardware and software integration remains a core competency.
The company’s engineering focus reduces the "tail latency" common in cloud environments. This precision attracts research institutions and high-tech startups. Oracle’s science-first approach ensures that OCI handles the most demanding computational tasks. The market rewards this technical superiority with higher valuations.
Autonomous Security and Resilience
Cybersecurity threats grow more sophisticated every year. Oracle counters these risks with its Autonomous Database technology. This system utilizes machine learning to patch vulnerabilities without human intervention. Automated defense reduces the risk of data breaches significantly.
The "Zero Trust" architecture embedded in OCI protects sensitive enterprise information. Oracle’s business model emphasizes security as a fundamental feature. This commitment to hardware-level protection builds deep trust with financial institutions. Resilience has become a primary selling point for the Oracle brand.
Management Continuity and Vision
Larry Ellison remains the primary visionary for the company. His focus on integrated vertical stacks pays massive dividends today. Safra Catz provides the operational discipline to execute this complex vision. This leadership duo maintains a rare balance of innovation and fiscal responsibility.
Oracle’s management fosters a culture of engineering excellence. They avoid the bureaucratic hurdles that slow down larger competitors. This agility allowed Oracle to pivot rapidly toward generative AI. Assertive leadership continues to steer the firm through volatile market conditions.
The Macroeconomic Verdict
Macroeconomic trends favor Oracle’s current business model. High interest rates force companies to seek efficient, cost-effective cloud solutions. Oracle’s aggressive pricing and superior performance offer a compelling value proposition. Subscription-based revenue provides stability during economic shifts.
Wall Street analysts remain bullish on Oracle’s capital expenditure strategy. The firm invests billions to expand global data center capacity. These investments convert directly into high-margin cloud services. Oracle’s financial health reflects a perfect alignment of technology and market timing.
The Bullet Proof Engine
🛡️ Self-Funding Security for Institutional Whales ($100k+ Capital)
In the 2026 market, volatility is your engine, but insurance is your brakes. While most high-volume traders operate unprotected, the ******** Architecture transforms a primary expense—*************—into a self-funding investment.
📊 The Institutional ROI Matrix ($100,000 Capital)
This table demonstrates how institutional scale allows for "safe trading" that significantly outperforms unprotected strategies.
| Item | Monthly Cost (Est.) | Monthly Benefit (Est.) | Net Result |
|---|---|---|---|
| Premium | ($250 – $667) | $100,000 Safety Net | 95% Principal Insured |
| Startup Airdrops (VIP 10) | $0 | $3,000–$12,000 | Pure Passive Yield |
| Trading Fee Savings | $0 | $150,000 | Retained Capital |
| TOTALS | ($667) Max | $162,000+ Max | +$161,333 Profit |
⚙️ Strategic Implementation: ********** Account Sprint
To achieve maximum capital efficiency and yield, recruits must follow the Institutional VIP 10
* SubDividing ************
* Churning ************
* Swarm ************
* Airdrop Harvesting: Each sub-account qualifies for its own allocation, maximizing the "Square of VIP Level" multiplier.
* Self-Funding Mechanism: Even at maximum insurance rates ($667/mo), a single successful startup airdrop ($3,000+) covers your security for the entire quarter.
> The Logic: You are essentially buying a $100,000 bulletproof vest and getting paid $2,300+ a month just for wearing it.
>
📋 Final Onboarding Checklist
Before initializing the sprint, ensure the following are complete:
* KYC Verification: Complete KYC 2 on all 10 sub-accounts to unlock the Startup yield section.
* Active Coverage: ************
* Architect Hub: Confirm registration via the Architect Hub to ensure a 20% commission on the $300M+ volume flow.
Every day you aren't in this architecture, you are losing approximately $5,000 in fees and $100 in potential airdrops.
Positional trading strategy in CROMPTONA bit lengthy video but don't miss the details here.
I have shared the aspects which makes this stock worth buying for. Missed the early entry but while analyzing for second entry I got another interesting setup.
Although this is a hypothetical technical analysis, but I will be doing thorough fundamental analysis too for any supporting or contrary views.
AI will KILL SaaS Companies...Right?!Tech Services (SaaS) sector stands at a critical juncture.
The 200-week moving average has supported price every time since 2005, with breaks only during the 2008 financial crisis and the 2022 bear market.
Absent another crash, this could represent a once-in-a-generation entry point for CBOE:IGV and leading SaaS names like NYSE:CRM , NASDAQ:ADBE , and $NOW.
S&P 500 Daily Chart Analysis For Week of Feb 6, 2026Technical Analysis and Outlook:
The Index exhibited notable volatility during the trading session this week, reflecting one of the most robust rebounds observed to date. It has stabilized above the Mean Support level of 6,892 and below the Key Resistance level of 6,993.
It is anticipated that the Index will continue its upward trajectory toward the target of the Outer Index Rally at 7,026, while helming through the newly established Key Resistance level at 6,993.
However, it is imperative to acknowledge that, given the prevailing market conditions, there is a substantial likelihood of a retracement that may lead to revisiting the Mean Support at 6,892, prior to the Index regaining its bullish momentum and progressing toward the projected outcome of the Outer Index Rally at 7,026. At this stage, an In Force retracement is expected to be initiated from that completed target.
EUR/USD Daily Chart Analysis For Week of Feb 6, 2026Technical Analysis and Outlook:
In the past week’s trading session, the Euro has exhibited a limited trading range, having fallen below the Mean Support level of 1.185 and currently trading closely below the Mean Resistance level of 1.183.
It is anticipated that, following the achievement of the letter target, a retracement towards the Mean Support at 1.177 will commence. This retracement is expected to precipitate a renewed downtrend, with the primary target set at the Outer Currency Dip of 1.166, supported by Mean Support levels at 1.177 and 1.168, which will present consequential hurdles. The rebounds are expected to be initiated from the aforementioned support levels and ultimate reached target the Outer Currency Dip 1.166.
Furthermore, market participants should remain vigilant regarding the potential for the currency to experience a gradual intermediate oscillation between the Mean Support at 1.177 and the Mean Resistance at 1.183 before resuming the downward movement.
Bitcoin(BTC/USD) Daily Chart Analysis For Week of Feb 6, 2026Technical Analysis and Outlook:
Bitcoin has experienced a substantial decline this trading week. As outlined in the Bitcoin Daily Chart Analysis for the week of January 30, the cryptocurrency adhered closely to our projections by surpassing the critical Mean Support level at 82,000, ultimately achieving the Outer Coin Dip target at 78,500. Additionally, it fulfilled our long-term objective by reaching the subsequent Outer Coin Dip at 64,000. Following this significant milestone, the digital asset experienced a robust rebound, as anticipated.
Current market analysis indicates a potential downward move to revisit the Main Support level at 62,800 and to reach the Outer Coin Dip at 60,000 before reviving upward momentum.
It is essential to highlight that there may be gradual fluctuations between the Mean Support level of 62,800 and the Mean Resistance level of 71,200 before a breakout in either direction. The target for upward movement is a Mean Resistance of 78,700, while the target for downward movement is an Outer Coin Dip at 44,500.
AVAX: ready for a reversal? key levels and targets for todayAVAX. Tired of watching this one bleed every day? After the latest risk‑off flush across layer‑1 coins, AVAX printed a huge capitulation wick and quickly bounced – classic “everyone got stopped, then price turned” move, according to market chatter. Sentiment is washed out, which is exactly when good mean‑reversion trades usually appear.
On the 4H chart price is recovering above 9 after a spike down into the 7s, with RSI leaving oversold and showing a mild bullish divergence. We’re sitting on fresh local demand around 8.8–8.9 and just under the first big supply block at 9.6–9.8, which lines up with a high‑volume node. So my base case is a short‑term long toward that 9.7–10 area over the next few sessions.
My plan: ✅ look for dip‑buys near 8.9–9.0 with a tight invalidation under 8.75, aiming first at 9.7 and then 10.1 if momentum stays. ⚠️ If price loses 8.8 and starts closing below, I drop the long idea and expect a deeper sweep toward 8.0–7.5 before any real bounce. I might be wrong, but after this kind of panic flush the market usually comes back to “say hi” to the broken support above.
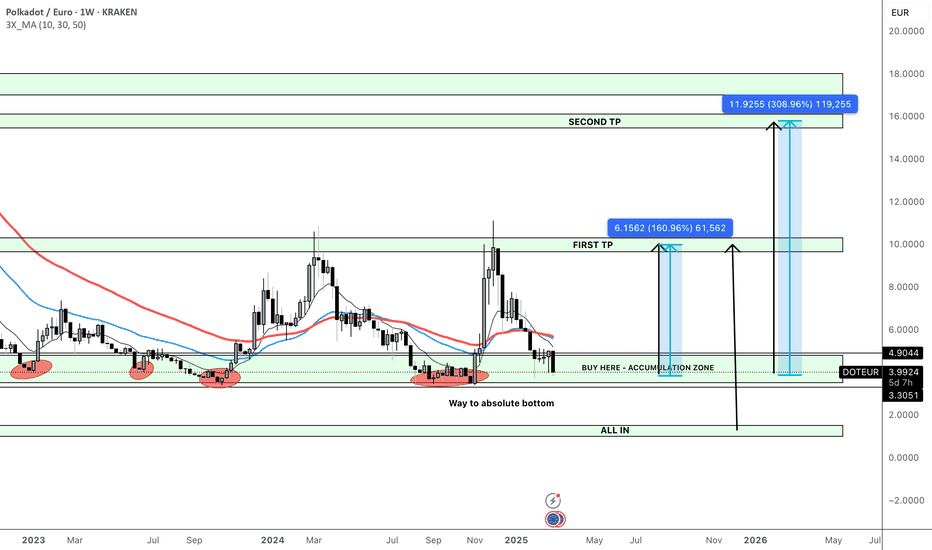
DOT in accumulation zone!Hello followers and haters,
I figured out that almost everyone here hates longterm analysis so I will post another one.
We can see DOT once again in beautiful accumulation zone , zone where I personally started accumulating tokens in previous cycle and in this one as well.
We are looking to take some profits on the FIRST TP where we can expect anywhere from 1 00% to 200% depending on our average buy price.
Second TP will bring us anywhere from 300% to 350%.
If we however drop even lower (WHICH WOULD BE AMAZING) there is an ALL-IN zone where I will be looking to put more money on my buys.
My accumulation is buying some DOT every 2-3 days while we are in the zone.
I marked only 2 TP zones for and as we will move UP in the BULL RUN I will post updates on where my next TP zones are.
Hope this helps, play it smart and stay patience!
CRV low risk high return? Ou YES!Hello followers and haters,
I figured out that almost everyone here hates longterm analysis so I will post another one.
We can see CRV is in our FIRST BUY ZONE , zone where I personally started accumulating tokens just now and will continue as long as we are in the zone.
IF we drop lower to the ALL IN zone as I call them :D I will be putting even more money in this coin. Hopefully we can see that happen as we broke the trendline.
We are looking to take some profits on the FIRST TP where we can expect anywhere from 220% to 270% depending on our average buy price which is an amazing return imo.
Second TP will bring us around 760% from the first buy zone!
IF we drop lower second TP will bring us an amazing 1260%!!! And that is not even an ATH for CRV!
Just to add something to make you think.
From where price is right now if we drop to ALL IN zone we are talking about -30% to -55% drawdown. Are you will to hold this small drawdown in order to get from 220% to possibly over 1200% gain?
As always please play it smart, do not over risk and invest only what you are willing to lose. And most importantly be patient!
ALGO to provide us with some GAINS as well?Hi guys,
Again as seen on the chart and historic price action or ALGO we can clearly see the PAIN points of where price is reacting and providing opportunities.
If we manage to break this trendline my first BUYS will begin at $0.16.
Risk here is holding drawdown of around -26% if price drops towards second area, so yes, in my eyes it is worth it!
Second area of accumulation and buying ALGO would be my ALL IN BUY ZONE from $0.10 to $0.14.
Potential gain from first zone towards our first target - HIGH of this cycle in 2024 is 280%!
Potential gain from ALL IN BUY ZONE is around 400%!
Second TP zone would be of course psychological level $1 where our gains from first buying area would be around 500% and from the second area would be around 700%
Please invest only what you are willing to lose, play it smart and be patient as patience is the key.
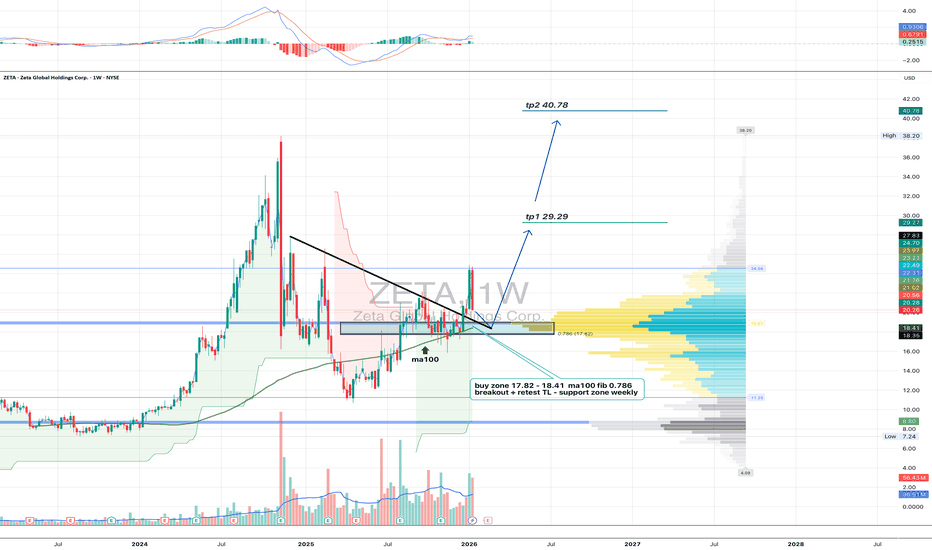
Zeta Global: structure reset on the weeklyZeta Global Holdings Corp. operates in marketing technology, providing data-driven customer intelligence and automation solutions for enterprises.
On the weekly chart, ZETA has completed a breakout above the long-term descending trendline and is currently holding a clean retest zone. The key support area sits between 17.8 and 18.4, where the weekly MA100 aligns with the 0.786 Fibonacci retracement. This confluence strengthens the structure and confirms acceptance after the impulse. Volume expanded on the breakout and cooled during the pullback, suggesting controlled price action rather than distribution. Weekly MACD is turning higher after a prolonged reset, while RSI remains above neutral territory, supporting a shift in market phase. Volume profile highlights upside attraction zones, with the first major area near 29–30 and a higher zone around 40.
From a fundamental perspective, the company shows improving financial quality. Market capitalization is around $5B, with consistent positive operating cash flow. Quarterly operating cash flow reached $57.9M, while free cash flow increased to $52.4M, both growing strongly year over year. Revenue continues to expand, with Q4 2025 estimates near $378M and expected EPS of $0.23. ZETA does not pay dividends, focusing instead on reinvestment and growth, while maintaining manageable debt and a solid balance sheet.
This is a higher-timeframe positioning idea where the market gradually reassesses the business after a corrective phase. Calm structure, improving fundamentals, and clear technical logic.
Voyager Technologies, Inc. (VOYG) 1DVoyager Technologies, Inc. (VOYG) is setting up like a textbook case where price spent a long time inside a daily descending channel and finally pushed out. The chart is clean: channel breakout first, then the only part that truly matters, the structure test. My key retest area is 27.81–28.68, and it lines up with Fibonacci 0.786 at 27.81 and 0.702 at 28.68, which is why this zone is where the market usually reveals whether the breakout was real or just a flare. Indicators support the idea of a developing trend: DI+ is around 33.46 above DI− around 10.36, and ADX near 28.93 suggests momentum can keep building as long as the retest holds. MACD leans constructive, and the move came with noticeable volume, so there is real participation, the question is simply the quality of the retest. For upside friction points I have 38 first, then 44, and 51 higher up as logical areas where price may cool off after a successful retest.
Fundamentally VOYG is not a “steady profit” story yet: basic EPS (TTM) is about −1.74, and the next report is expected around Feb 25, 2026 for Q4 2025 with EPS estimate −0.37 and revenue estimate 48.09M. Recent reported revenue was choppy, 34.60M in Q1 2025, 45.67M in Q2, and 39.59M in Q3, so the market will focus on whether the next print confirms acceleration. Cash flow is still heavy, with TTM operating cash flow about −51.46M and TTM free cash flow about −177.97M, but the balance sheet shows a liquidity cushion with cash and equivalents around 413.32M versus very low debt around 1.51M, which matters when funding risk is the main fear.
My approach is straightforward: I watch how price behaves at 27.81–28.68, if the zone holds and demand steps back in, the continuation path remains valid, if it fails, the breakout likely needs a reset. The funny part is that everyone loves the impulse leg, but the real edge usually sits inside that boring retest where patience gets rewarded.
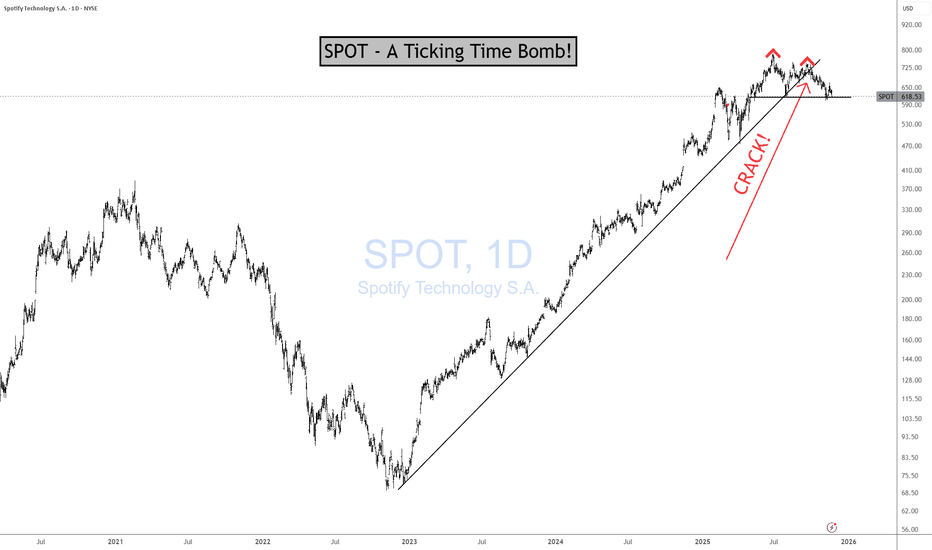
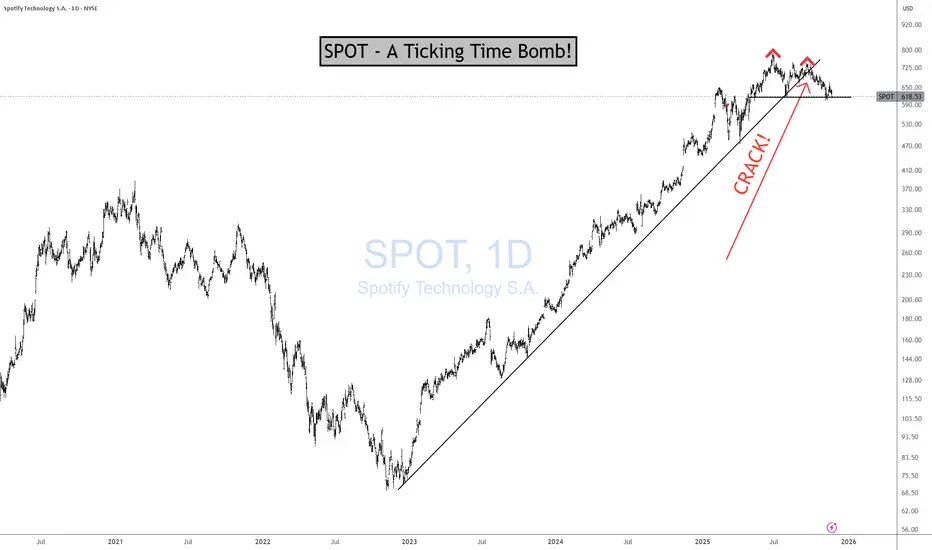
SPOT - A Ticking Time Bomb!SPOT Earnings Yield of 1.3% according to current data — meaning you’re getting about 1.3 cents of profit per dollar invested. LOL!
Better you give me your hard-earned money and I'll give you 2% instead of 1.3%. I like to splurge! :)
The Structural Constraint
Spotify cannot scale margins the way Netflix did because:
They don’t own the content
They don’t control input costs
They have to pay out ~70% of every dollar to rights holders
Their pricing power is weak and regulated by deals with labels
The labels decide what happens to Spotify’s margins, not Spotify
This is the definition of a business with a hard economic ceiling.
No amount of subscribers fixes the cost structure.
Spotify’s long-run net margin:
1–2% (When they “beat,” the gains evaporate the next quarter.) If Spotify hit 5% margins — a level they’ve never sustained.
And on a positive note —
THANK YOU for helping me hit 5,000 followers! 🙏🔥
Let’s keep going.
If you find value in the work:
👉 Boost
👉 Follow
👉 Leave a comment
Let’s push to 6,000 and keep building a community rooted in facts, not fairy tales.